Veda Skills Quantitative Aptitude Unit 17:
Data Interpretation
Data Interpretation is Unit 17 of
Veda Skills Quantitative Aptitude.
This page has the complete chapter notes across 3 topics, 192 practice MCQs with answers and explanations, 15 important short and long questions and 42 flashcards, written for SSC, Bank, Railway and placement exams and free to read.
3 topics
192 MCQs
12 short answers
3 long answers
42 flashcards
3 games
~190 min read
English
Checked before publishing: 23 automated checks, including a
plagiarism check against the textbook's own words.
How we check our content
Tables and Bar Graphs
Read tables, simple bars, grouped bars and stacked bars quickly and correctly, then answer the five question types that make up most Bank and SSC DI sets: totals, averages, ratios, percentage change and “X is what percent of Y”.
What you will be able to do
I can read the title, unit, scale and legend of a table or bar graph before answering.
I can find totals, averages and ratios from a chart in under a minute.
I can compute percentage increase and decrease using the correct base.
I can compare two series in a grouped or stacked bar graph.
I can approximate a calculation to pick the right option fast.
Key points
Always read the unit: a bar marked 120 in a chart “in hundreds” means 12,000.
Average = total ÷ number of values. Count the values carefully: 2019 to 2024 is six years, not five.
Percentage change = (new − old) ÷ old × 100. The base is always the earlier or the “than” value.
“X is what percent of Y” = X ÷ Y × 100; “X is what percent more than Y” = (X − Y) ÷ Y × 100.
A ratio is written in lowest terms: 60 : 80 = 3 : 4.
In a grouped bar graph, each colour is one series; compare bars of the same colour across categories.
In a stacked bar, the top of the bar is the total; each segment is one part.
The biggest jump in units is not always the biggest percentage jump: a small base gives a big percentage.
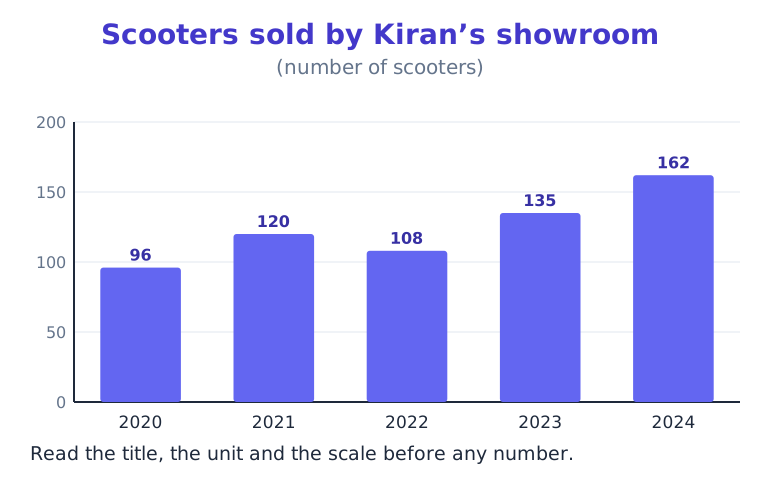
Kiran manages a scooter showroom. Every January the owner asks him three things: how many scooters did we sell on average, which year grew the fastest, and how does this year compare with the first year?
Kiran answers from one bar chart in two minutes. A Bank PO DI set asks exactly these questions. Let us learn to do what Kiran does.
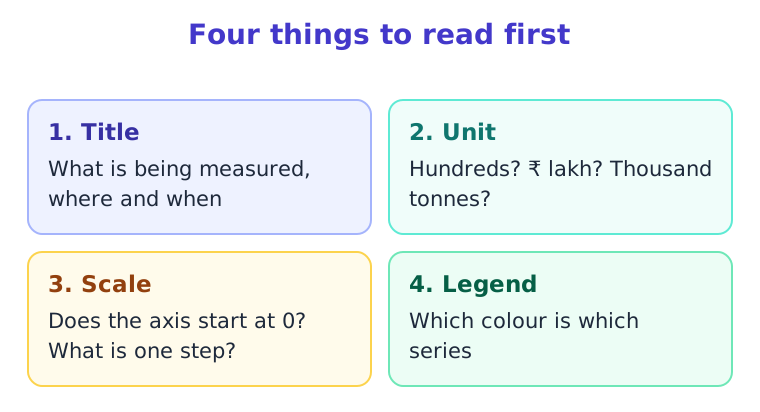
Read before you calculate
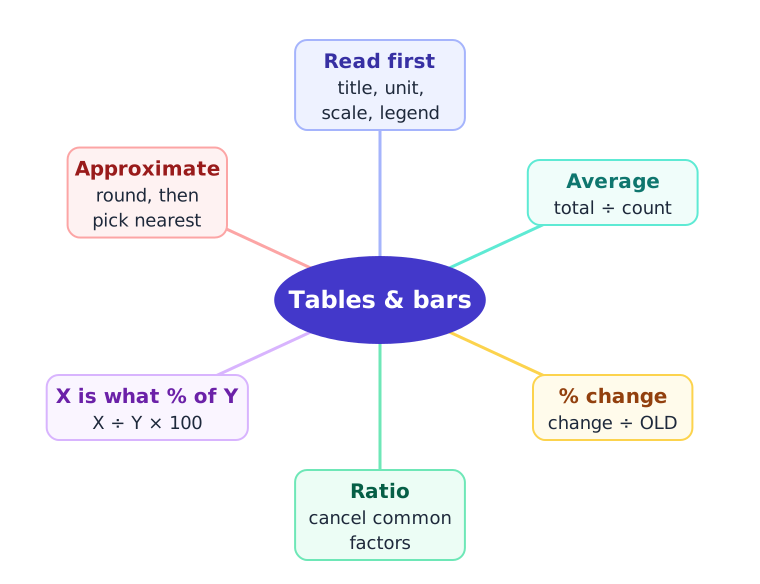
Every chart has four parts you must read first. Skipping them is the number one cause of wrong answers in DI.
A simple bar graph
Each bar is one year, and its height is the number sold. The gaps between bars tell you the years are separate categories.
Totals and averages
Total = 96 + 120 + 108 + 135 + 162 = 621.
Average = 621 ÷ 5 = 124.2 scooters a year.
Speed trick: pick a round guess such as 120, add the differences (−24, 0, −12, +15, +42 = +21), and share them: 120 + 21 ÷ 5 = 124.2.
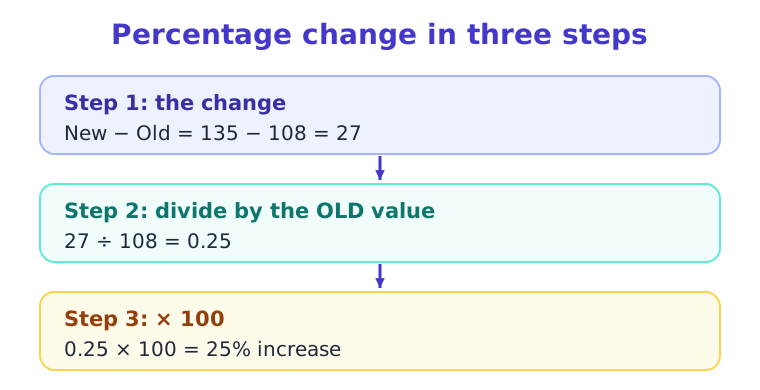
Percentage change: the base matters
From 2022 to 2023 sales rose from 108 to 135. The change is 27, and we divide by the old value 108, not the new one.
Units jump, percentages do not always
2020 to 2021: +24 on a base of 96 = 25%. 2023 to 2024: +27 on a base of 135 = 20%.
The 2024 jump is bigger in scooters but smaller in percent. Exams love this trap: “highest percentage growth” is about the ratio, not the raw jump.
Ratios and “what percent of”
Ratio of 2020 to 2024 sales = 96 : 162. Both divide by 6, so it is 16 : 27.
2020 sales as a percent of 2024 sales = 96 ÷ 162 × 100 ≈ 59.26%. 2024 is (162 − 96) ÷ 96 × 100 = 68.75% more than 2020.
Tables: build a total column
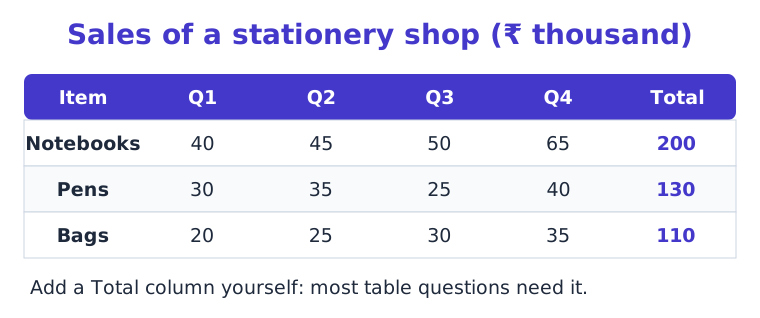
A table gives exact numbers, so there is nothing to estimate. Most questions need row or column totals, so write them in the margin first.
Grouped and stacked bars
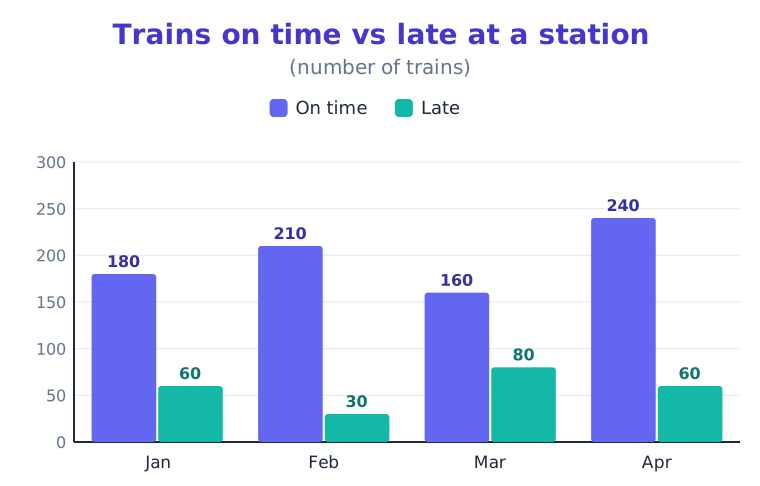
In a grouped bar graph, two or more bars stand side by side for each category. Compare same-colour bars across months, or the two bars within one month.
In a stacked bar, the parts sit on top of one another and the bar top is the total. A middle segment’s value is its top edge minus its bottom edge.
Approximate, then choose
Options in DI are usually far apart. 34.8% of 4,987 is close to 35% of 5,000 = 1,750. If the options are 1,580, 1,740, 1,920 and 2,050, pick 1,740 without exact work.
Back to Kiran
Average sales: 124.2 a year. Fastest growth: 2021 and 2023 tie at 25%, ahead of 2024 at 20%. 2024 against 2020: 68.75% more.
Three answers, one chart, two minutes. That is DI: read first, choose the right base, and let the options guide your rounding.
Concepts and terms
Bar graph
Bars of equal width whose heights show values; the gaps between bars mean the categories are separate.
Grouped and stacked bars
Grouped bars stand side by side to compare series; stacked bars sit on top of each other so the bar height is the total.
Base of a percentage
The value you divide by. For change over time it is the old value; for “more than Y” it is Y.
Approximation
Rounding numbers to friendly values so that the nearest option can be picked without exact division.
Did you know
William Playfair drew the first bar chart in 1786 to show Scotland’s trade with other countries.
In IBPS and SBI Prelims, DI sets usually carry 10 to 15 of the 35 maths marks.
Memory tricks
Percentage change — Change over Old, times a hundred (COO) — Find the change, divide by the old value, multiply by 100.
Reading a chart — TUSL: Title, Unit, Scale, Legend — Read these four before touching any number.
Practice MCQs with answers (66)
Q1
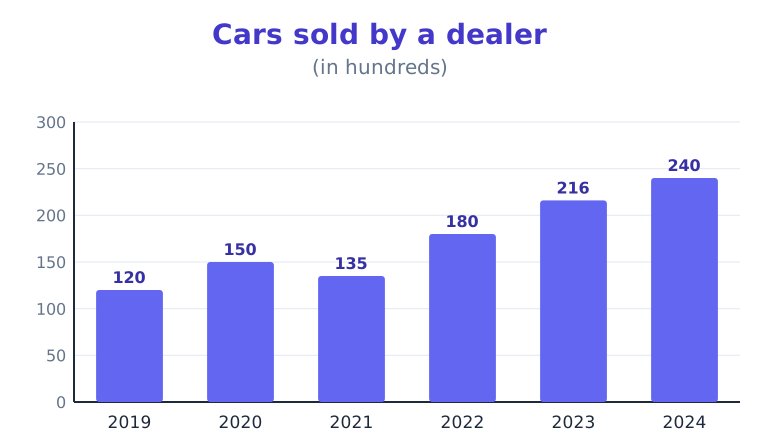
What is the average number of cars sold per year (in hundreds)?
beginner
Q2
By what percentage did the number of cars sold rise from 2021 to 2022 (correct to two decimal places)?

intermediate
A133.33%
B45%
C25%
D33.33%
Show answer
Answer: 33.33%
Why:
Change = 180 − 135 = +45. Percentage change = 45 ÷ 135 × 100 = 33.33%. The base is the older value, 135.
Q3
What is the ratio of the number of cars sold in 2019 to the number of cars sold in 2024?

beginner
A1 : 2
B1 : 1
C3 : 2
D2 : 1
Show answer
Answer: 1 : 2
Why:
120 : 240; divide both by 120 to get 1 : 2.
Q4
In how many years was the number of cars sold above the average for all the years?

intermediate
A5
B3
C4
D2
Show answer
Answer: 3
Why:
Average = 1,041 ÷ 6 = 173.5. Above it: 2022, 2023, 2024, so 3.
Q5
In which year did the number of cars sold show the highest percentage increase over the previous year?

advanced
A2023
B2024
C2022
D2020
Show answer
Answer: 2022
Why:
Percentage change each year: 2020: 25%, 2021: -10%, 2022: 33.33%, 2023: 20%, 2024: 11.11%. The biggest is 2022. (The biggest jump in units is not always the biggest percentage.)
Q6
In which year was the ratio of the sales to the production the highest?
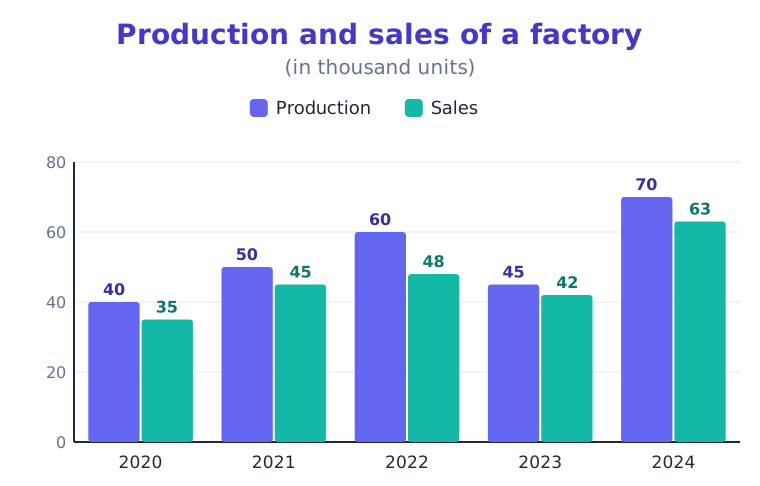
advanced
Q7
What is the difference between the total production and the total sales over all the years (in thousand units)?

intermediate
A32
B28
C37
D42
Show answer
Answer: 32
Why:
Totals 265 and 233; difference = 32. Shortcut: add the year-by-year gaps.
Q8
By what percentage did the production rise from 2023 to 2024 (correct to two decimal places)?

intermediate
A35.71%
B55.56%
C155.56%
D25%
Show answer
Answer: 55.56%
Why:
Change = 70 − 45 = +25. Percentage change = 25 ÷ 45 × 100 = 55.56%. The base is the older value, 45.
Q9
In 2022, express the sales as a percentage of the production.

beginner
A20%
B25%
C80%
D125%
Show answer
Answer: 80%
Why:
48 ÷ 60 × 100 = 80%.
Q10
What is the ratio of the total production to the total sales over all the years?

intermediate
A265 : 296
B233 : 265
C225 : 233
D265 : 233
Show answer
Answer: 265 : 233
Why:
Totals: 40 + 50 + 60 + 45 + 70 = 265 and 35 + 45 + 48 + 42 + 63 = 233. The ratio is 265 : 233; it does not simplify.
Q11
What is the average Maths mark per student?
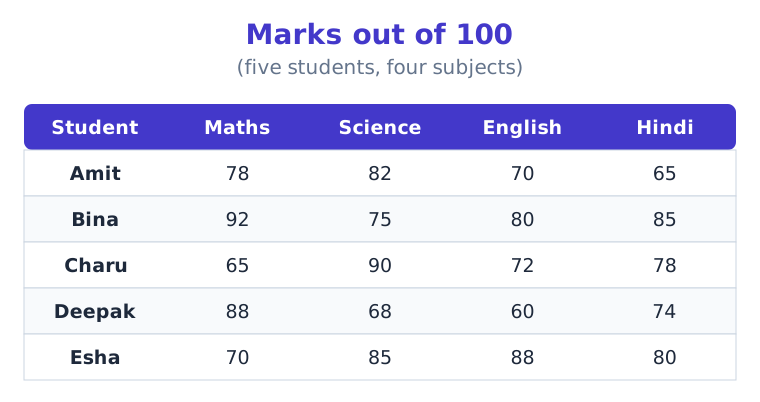
beginner
A78.6
B65.5
C78
D98.25
Show answer
Answer: 78.6
Why:
Total = 78 + 92 + 65 + 88 + 70 = 393. Average = 393 ÷ 5 = 78.6.
Q12
What is Charu’s average mark over the four subjects?

intermediate
A90
B76.25
C65
D101.67
Show answer
Answer: 76.25
Why:
(65 + 90 + 72 + 78) ÷ 4 = 305 ÷ 4 = 76.25.
Q13
Which student has the highest total marks in the four subjects?

intermediate
AEsha
BCharu
CBina
DAmit
Show answer
Answer: Bina
Why:
Totals: Amit 295, Bina 332, Charu 305, Deepak 290, Esha 323. Highest: Bina.
Q14
For how many students was the Science mark above the average for all the students?

beginner
A5
B4
C2
D3
Show answer
Answer: 3
Why:
Average = 400 ÷ 5 = 80. Above it: Amit, Charu, Esha, so 3.
Q15
Express the English mark for Deepak as a percentage of the English mark for Esha (correct to two decimal places).

advanced
A68.18%
B146.67%
C31.82%
D46.67%
Show answer
Answer: 68.18%
Why:
60 ÷ 88 × 100 = 68.18%.
Q16
In school C, what is the ratio of the number of boys to the number of girls?
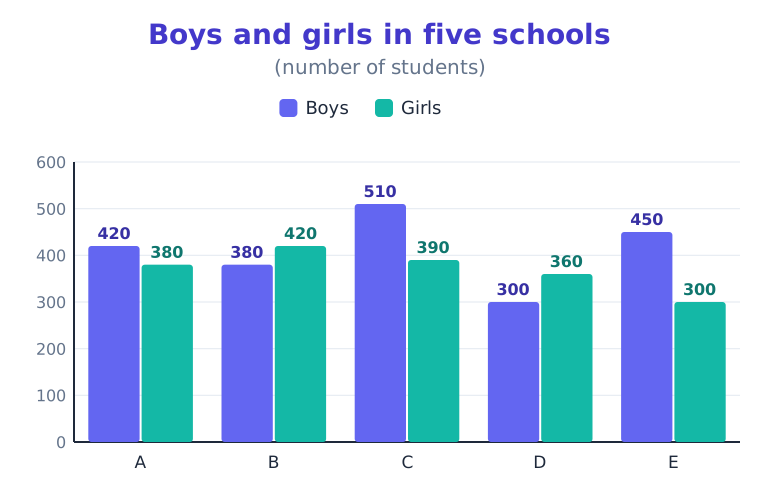
intermediate
A10 : 13
B17 : 13
C13 : 17
D17 : 12
Show answer
Answer: 17 : 13
Why:
510 : 390; divide both by 30 to get 17 : 13.
Q17
In school E, what percentage of the combined total is the number of girls?

beginner
Q18
In which school was the gap between the number of boys and the number of girls the widest?

advanced
Q19
What is the ratio of the total number of boys to the total number of girls over all the schools?

intermediate
Q20
In school D, express the number of girls as a percentage of the number of boys.

intermediate
A16.67%
B120%
C83.33%
D20%
Show answer
Answer: 120%
Why:
360 ÷ 300 × 100 = 120%.
Q21
What is the combined total of the three products in Q3 (in ₹ lakh)?
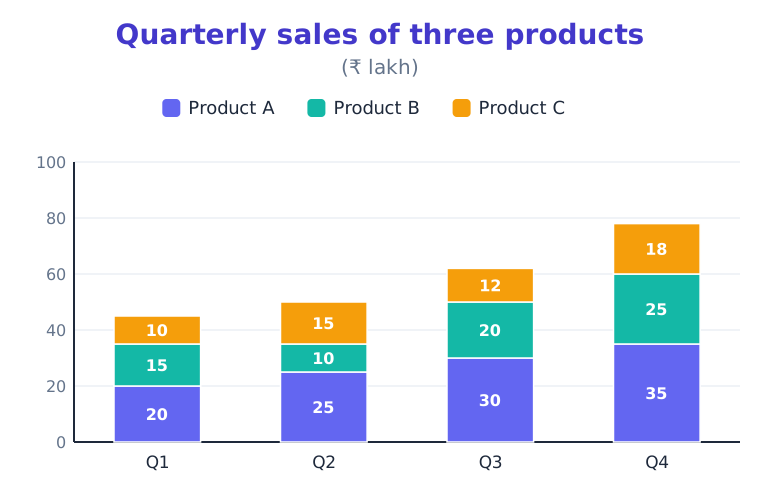
beginner
A92
B78
C62
D50
Show answer
Answer: 62
Why:
30 + 20 + 12 = 62.
Q22
In Q4, what percentage of the combined total is the sales of product B (correct to two decimal places)?

intermediate
Q23
What is the percentage increase in the combined total from Q1 to Q4 (correct to two decimal places)?

advanced
Q24
What is the total sales of product C over all the quarters (in ₹ lakh)?

beginner
A37
B55
C65
D45
Show answer
Answer: 55
Why:
10 + 15 + 12 + 18 = 55.
Q25
In Q2, what is the ratio of the sales of product A to the sales of product C?

intermediate
A3 : 5
B25 : 12
C5 : 3
D2 : 1
Show answer
Answer: 5 : 3
Why:
25 : 15; divide both by 5 to get 5 : 3.
Q26
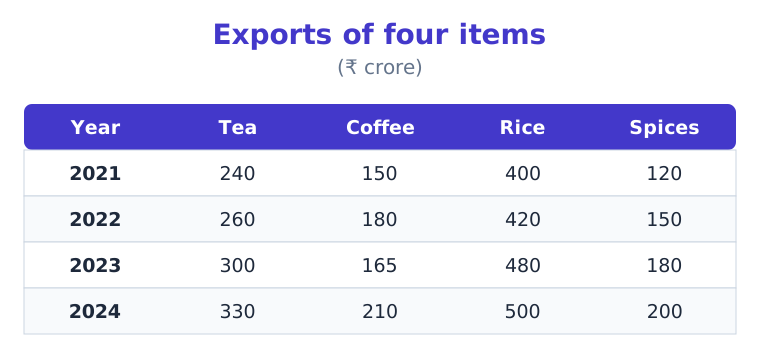
By what percentage did the spice exports rise from 2021 to 2024 (correct to two decimal places)?
advanced
A166.67%
B80%
C40%
D66.67%
Show answer
Answer: 66.67%
Why:
Change = 200 − 120 = +80. Percentage change = 80 ÷ 120 × 100 = 66.67%. The base is the older value, 120.
Q27
What is the combined total of all four items in 2023 (in ₹ crore)?

beginner
A1,125
B945
C1,425
D1,240
Show answer
Answer: 1,125
Why:
300 + 165 + 480 + 180 = 1,125.
Q28
In 2022, what is the ratio of the tea exports to the coffee exports?

intermediate
A5 : 3
B13 : 9
C9 : 13
D52 : 33
Show answer
Answer: 13 : 9
Why:
260 : 180; divide both by 20 to get 13 : 9.
Q29
In 2024, what percentage of the combined total is the rice exports (correct to two decimal places)?

advanced
Q30
What is the average coffee exports per year (in ₹ crore)?

intermediate
A141
B180
C235
D176.25
Show answer
Answer: 176.25
Why:
Total = 150 + 180 + 165 + 210 = 705. Average = 705 ÷ 4 = 176.25.
Q31
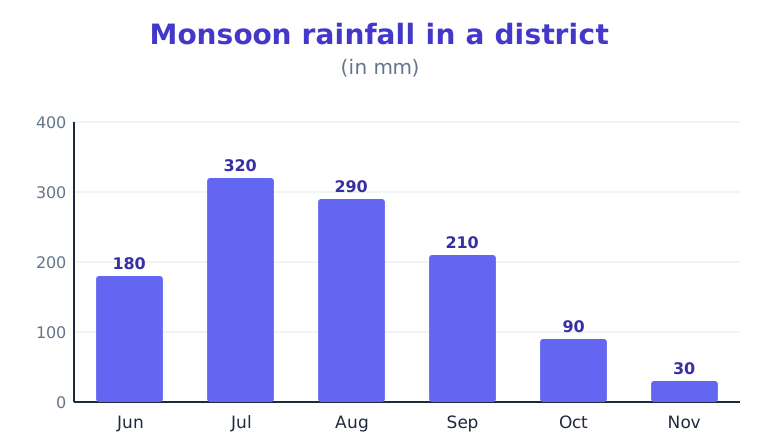
What is the average rainfall per month (in mm) (correct to two decimal places)?
intermediate
Q32
Express the rainfall in Nov as a percentage of the rainfall in Jul (correct to two decimal places).

advanced
A90.62%
B9.38%
C966.67%
D1,066.67%
Show answer
Answer: 9.38%
Why:
30 ÷ 320 × 100 = 9.38%.
Q33
In how many months was the rainfall above the average for all the months?

beginner
A5
B4
C3
D2
Show answer
Answer: 3
Why:
Average = 1,120 ÷ 6 = 186.67. Above it: Jul, Aug, Sep, so 3.
Q34
What is the ratio of the rainfall in Jun to the rainfall in Sep?

beginner
A7 : 6
B2 : 1
C3 : 7
D6 : 7
Show answer
Answer: 6 : 7
Why:
180 : 210; divide both by 30 to get 6 : 7.
Q35
By what percentage did the rainfall fall from Aug to Sep (correct to two decimal places)?

intermediate
A27.59%
B80%
C38.1%
D72.41%
Show answer
Answer: 27.59%
Why:
Change = 210 − 290 = −80. Percentage change = 80 ÷ 290 × 100 = 27.59%. The base is the older value, 290.
Q36
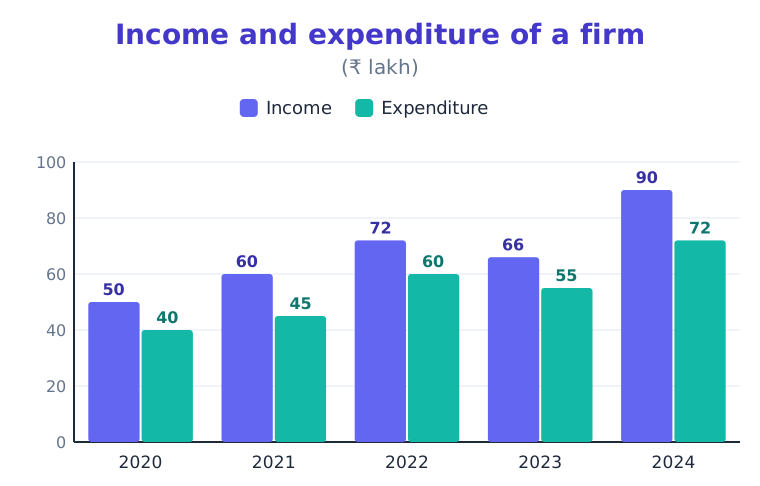
Profit % = (income − expenditure) ÷ expenditure × 100. In which year was the profit percentage the highest?
advanced
A2024
B2021
C2020
D2022
Show answer
Answer: 2021
Why:
Profit %: 2020: 25%, 2021: 33.33%, 2022: 20%, 2023: 20%, 2024: 25%. Highest: 2021. The largest rupee profit (2024) is a trap.
Q37
What is the total profit (income − expenditure) of the firm over all five years (in ₹ lakh)?

intermediate
A56
B84
C66
D338
Show answer
Answer: 66
Why:
Yearly profits: 10, 15, 12, 11, 18. Total = 66.
Q38
What was the profit percentage of the firm in 2024, taking profit % = (income − expenditure) ÷ expenditure × 100?

intermediate
A20%
B18%
C125%
D25%
Show answer
Answer: 25%
Why:
(90 − 72) ÷ 72 × 100 = 25%.
Q39
What is the average expenditure per year (in ₹ lakh)?

beginner
A54.4
B45.33
C55
D68
Show answer
Answer: 54.4
Why:
Total = 40 + 45 + 60 + 55 + 72 = 272. Average = 272 ÷ 5 = 54.4.
Q40
By what percentage did the income rise from 2023 to 2024 (correct to two decimal places)?

intermediate
A24%
B36.36%
C26.67%
D136.36%
Show answer
Answer: 36.36%
Why:
Change = 90 − 66 = +24. Percentage change = 24 ÷ 66 × 100 = 36.36%. The base is the older value, 66.
Q41
What is the approximate value of 24.96% of 3,204?
beginner
A940
B870
C800
D730
Show answer
Answer: 800
Why:
Round: 24.96% ≈ 25% and 3,204 ≈ 3,200. 25% of 3,200 = 800; the nearest option is 800.
Q42
What is the approximate value of 12.48% of 7,208?
intermediate
A820
B1,060
C980
D900
Show answer
Answer: 900
Why:
Round: 12.48% ≈ 12.5% and 7,208 ≈ 7,200. 12.5% of 7,200 = 900; the nearest option is 900.
Q43
What is the approximate value of 33.29% of 4,512?
intermediate
A1,500
B1,640
C1,360
D1,780
Show answer
Answer: 1,500
Why:
Round: 33.29% ≈ 33.33% and 4,512 ≈ 4,500. 33.33% of 4,500 = 1,500; the nearest option is 1,500.
Q44
What is the approximate value of 59.87% of 7,495?
advanced
A4,100
B4,500
C5,300
D4,900
Show answer
Answer: 4,500
Why:
Round: 59.87% ≈ 60% and 7,495 ≈ 7,500. 60% of 7,500 = 4,500; the nearest option is 4,500.
Q45
In a DI set you need 1/8 as a percentage. What is it (correct to two decimal places)?
beginner
A17.5%
B11.11%
C12.5%
D80%
Show answer
Answer: 12.5%
Why:
1 ÷ 8 × 100 = 12.5%.
Q46
In a DI set you need 5/6 as a percentage. What is it (correct to two decimal places)?
intermediate
A88.33%
B71.43%
C12%
D83.33%
Show answer
Answer: 83.33%
Why:
5 ÷ 6 × 100 = 83.33%.
Q47
In a DI set you need 3/16 as a percentage. What is it (correct to two decimal places)?
advanced
A18.75%
B53.33%
C23.75%
D17.65%
Show answer
Answer: 18.75%
Why:
3 ÷ 16 × 100 = 18.75%.
Q48
In a DI set you need 7/12 as a percentage. What is it (correct to two decimal places)?
intermediate
A53.85%
B58.33%
C17.14%
D63.33%
Show answer
Answer: 58.33%
Why:
7 ÷ 12 × 100 = 58.33%.
Q49
A school had 640 students in 2023 and 720 in 2024. What is the percentage increase?
beginner
A80%
B112.5%
C12.5%
D11.11%
Show answer
Answer: 12.5%
Why:
Change = 80; 80 ÷ 640 × 100 = 12.5%.
Q50
A shop sold 250 phones in March and 210 in April. What is the percentage decrease in sales?
intermediate
A84%
B19.05%
C40%
D16%
Show answer
Answer: 16%
Why:
Change = 40; 40 ÷ 250 × 100 = 16%.
Q51
The price of a kilogram of dal moved from ₹96 to ₹120. What is the percentage increase?
beginner
A25%
B20%
C24%
D125%
Show answer
Answer: 25%
Why:
Change = 24; 24 ÷ 96 × 100 = 25%.
Q52
A train carried 1350 passengers on Monday and 1180 on Tuesday. What is the percentage decrease (correct to two decimal places)?
advanced
A170%
B12.59%
C87.41%
D14.41%
Show answer
Answer: 12.59%
Why:
Change = 170; 170 ÷ 1350 × 100 = 12.59%.
Q53
A batter scores 48, 72, 35, 90, 65 in five matches. What is the average score?
beginner
A65
B64
C62
D77.5
Show answer
Answer: 62
Why:
Sum = 310; 310 ÷ 5 = 62.
Q54
A dairy collects 412, 398, 405, 420, 389, 416 litres of milk on six days. What is the average per day?
intermediate
A488
B412
C408.67
D406.67
Show answer
Answer: 406.67
Why:
Sum = 2440; 2440 ÷ 6 = 406.67.
Q55
The marks of four tests are 68, 79, 74, 71. What must the fifth test score be for an average of 75?
advanced
A83
B91
C75
D78
Show answer
Answer: 83
Why:
Needed total = 75 × 5 = 375. Already 292, so the fifth score = 375 − 292 = 83.
Q56
A company’s sales rose by 25% one year and fell by 20% the next. What is the net change over the two years?
intermediate
A5% increase
BNo change
C5% decrease
D2.5% increase
Show answer
Answer: No change
Why:
100 → 125 → 125 × 0.8 = 100. Net change 0.
Q57
A pass rate rose from 40% to 50%. Which statement is correct?
advanced
AIt rose by 20 percentage points
BIt rose by 50%
CIt rose by 10 percentage points, which is a 25% rise
DIt rose by 10%
Show answer
Answer: It rose by 10 percentage points, which is a 25% rise
Why:
50 − 40 = 10 points; 10 ÷ 40 × 100 = 25%.
Q58
Which chart is best for comparing the sales of two products year by year?
beginner
AA table of one row
BA stacked bar of one year
CA single pie chart
DA grouped bar graph
Show answer
Answer: A grouped bar graph
Why:
Grouped bars put the two products side by side for every year.
Q59
In a stacked bar graph, a segment runs from 30 to 55 on the axis. What is its value?
beginner
A25
B30
C85
D55
Show answer
Answer: 25
Why:
Value = top − bottom = 55 − 30 = 25.
Q60
A bar chart is labelled “in thousands” and a bar reaches 72. What value does it show?
beginner
A7,20,000
B72,000
C72
D7,200
Show answer
Answer: 72,000
Why:
72 thousand = 72,000.
Q61
If A is 25% more than B, then B is how much less than A?
intermediate
A15%
B22.5%
C20%
D25%
Show answer
Answer: 20%
Why:
Take B = 100, A = 125. B is 25 less on a base of 125 = 20%.
Q62
The axis of a bar graph starts at 400 instead of 0. Which is true?
intermediate
ARatios of bar heights equal ratios of values
BThe chart cannot be read
CThe values themselves change
DBar heights exaggerate the differences between values
Show answer
Answer: Bar heights exaggerate the differences between values
Why:
The values are the same, but a cut axis makes a small difference look large. Use the numbers, not the heights.
Q63
Assertion (A): If sales rise from 80 to 100, the percentage increase is 25%.
Reason (R): Percentage change is always calculated on the original value.
beginner
ABoth A and R are true, and R is the correct explanation of A
BBoth A and R are true, but R is not the correct explanation of A
CA is true but R is false
DA is false but R is true
Show answer
Answer: Both A and R are true, and R is the correct explanation of A
Why:
20 ÷ 80 × 100 = 25%, and the reason is exactly the base rule.
Q64
Assertion (A): In a stacked bar graph, the height of the whole bar is the total of its parts.
Reason (R): A stacked bar graph must always start its axis at 100.
intermediate
ABoth A and R are true, and R is the correct explanation of A
BBoth A and R are true, but R is not the correct explanation of A
CA is true but R is false
DA is false but R is true
Show answer
Answer: A is true but R is false
Why:
A is true. R is false: axes start at 0 so that the parts add up to the bar.
Q65
A value rises from 50 to 75 and then falls back to 50. Consider:
1. The rise is 50%.
2. The fall is 50%.
intermediate
A1 only
B2 only
CBoth 1 and 2
DNeither 1 nor 2
Show answer
Answer: 1 only
Why:
Rise = 25 ÷ 50 = 50%. Fall = 25 ÷ 75 = 33.33%, so statement 2 is false.
Q66
Consider the statements about averages:
1. Adding a value equal to the average does not change the average.
2. The average always equals one of the values.
advanced
A1 only
B2 only
CBoth 1 and 2
DNeither 1 nor 2
Show answer
Answer: 1 only
Why:
Statement 1 is true. The average of 1 and 2 is 1.5, which is not a value, so statement 2 is false.
Important short questions (4)
Sales were 240 in 2022 and 204 in 2023. Find the percentage decrease.
Fall = 36. 36 ÷ 240 × 100 = 15%.
A stacked bar for March has segments 0–40, 40–65 and 65–90. Find each part and the total.
Parts are 40, 25 and 25; total = 90 (the top of the bar).
Boys 540 and girls 450 in a school. Write the ratio of girls to boys and the girls’ share of the total.
Why can the year with the largest rise in units differ from the year with the largest percentage rise?
Percentage rise divides the rise by the base. A small base turns a small rise into a big percentage: +20 on 50 is 40%, +30 on 150 is 20%.
Long answer questions (1)
A firm’s income (₹ lakh) for 2021–2024 is 80, 96, 120, 132 and its expenditure is 64, 80, 96, 110. (a) Find the profit each year. (b) Find the profit % each year (on expenditure). (c) Which year was best, and why is it not the year of the largest rupee profit?
(c) 2021 and 2023 tie at 25%. 2023 also has the largest rupee profit (24), but 2021 earns the same rate on a smaller spend, so rate, not rupees, decides “best”.
Flashcards (15)
Percentage change formula?
(new − old) ÷ old × 100
X is what percent of Y?
X ÷ Y × 100
X is what percent more than Y?
(X − Y) ÷ Y × 100
Average of n values?
Sum ÷ n
1/8 as a percent?
12.5%
1/6 as a percent?
16.67%
5/6 as a percent?
83.33%
3/8 as a percent?
37.5%
In a stacked bar, the top of the bar shows?
The total of all parts
Value of a middle stacked segment?
Top edge − bottom edge
Ratio 450 : 600 in lowest terms?
3 : 4
20% to 25% is a rise of how many percentage points?
5 points (a 25% rise)
From 2018 to 2024 inclusive, how many years?
7
A rise of 25% then a fall of 20% gives?
No net change
Best chart to compare two series over years?
Grouped bar (or a two-line graph)
Play this topic
Chart sense
Pie Charts and Line Graphs
Turn pie-chart percentages and degrees into amounts, compare sectors without finding the total, and read line graphs for trends, steepest changes, crossings and percentage profit.
What you will be able to do
I can convert between percentages, degrees and amounts in a pie chart.
I can compare two sectors directly from their percentages or angles.
I can find the total from one known sector.
I can read a line graph for rises, falls and the steepest change.
I can use a profit-percent line graph with a given income or expenditure.
Key points
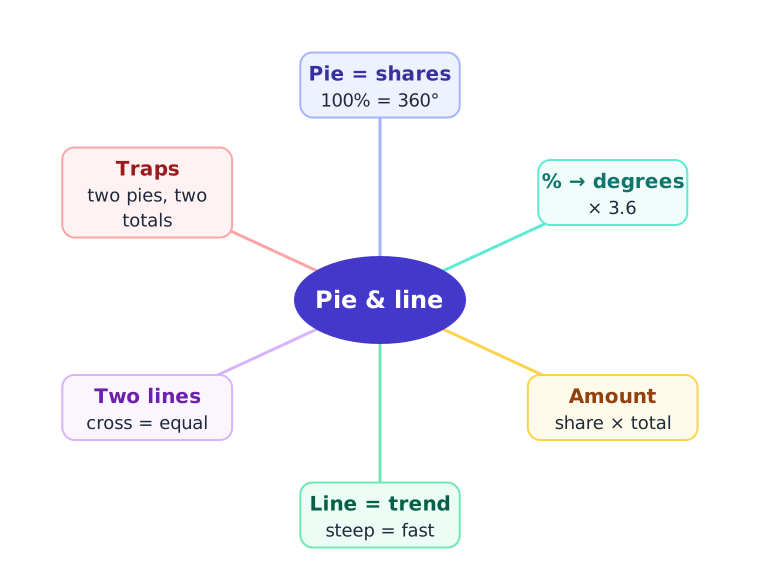
A pie chart shows parts of one whole: the percentages add to 100 and the angles add to 360°.
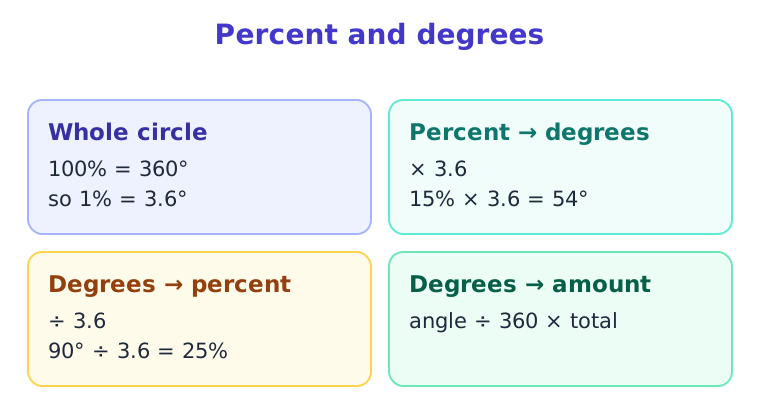
1% of a pie = 3.6°. Percent × 3.6 = degrees; degrees ÷ 3.6 = percent.
Amount of a sector = its share × the total = angle ÷ 360 × total.
The ratio of two sectors equals the ratio of their percentages or angles; the total cancels.
If one sector’s amount is known, other sectors follow by proportion: B = A × (B% ÷ A%).
A line graph shows change over time; a steeper segment means a faster change in units.
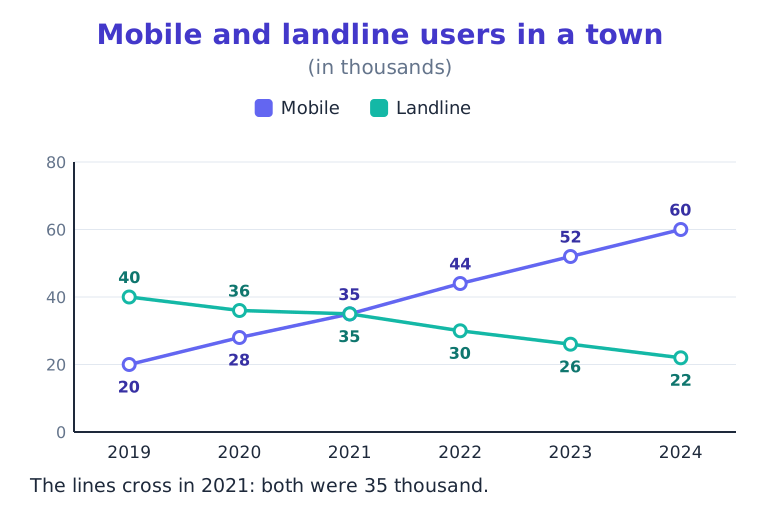
Where two lines cross, the two quantities are equal.
Profit % = (I − E) ÷ E × 100, so I = E × (1 + P/100) and E = I ÷ (1 + P/100).
Two pie charts with different totals cannot be compared by percentages alone: convert to amounts.
Full explanation
Anjali’s salary
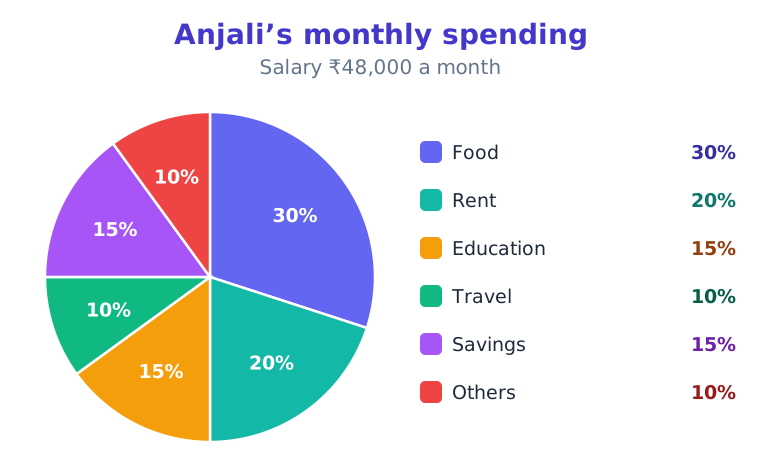
Anjali earns ₹48,000 a month. Her bank’s app draws her spending as a pie chart. She wants to know: how much goes on food, is rent more than savings, and how big is the education slice in degrees?
Pie charts answer “how is one whole shared out?”. Line graphs answer “how did it change over time?”. This topic covers both.
If only “travel = ₹4,800” were given, rent would be 4,800 × 20 ÷ 10 = ₹9,600, and the total 4,800 × 100 ÷ 10 = ₹48,000.
“More than” in a pie
Food is (30 − 20) ÷ 20 × 100 = 50% more than rent. Rent is (30 − 20) ÷ 30 × 100 ≈ 33.33% less than food.
Same two slices, two different bases.
Line graphs show change
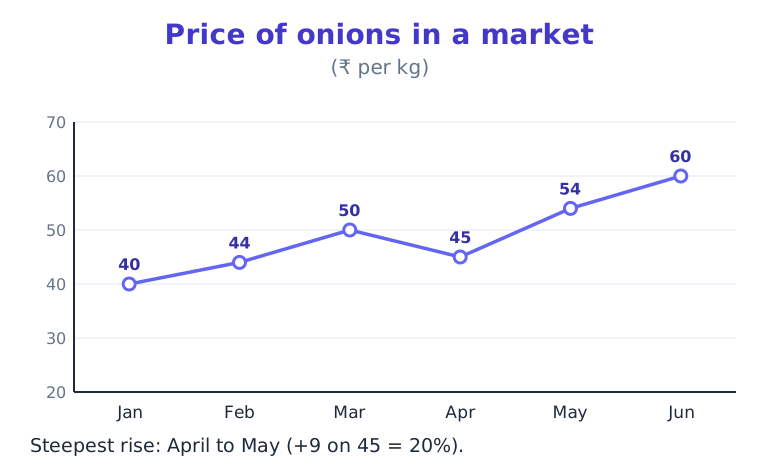
A line graph joins values in time order. Up means growth, down means a fall. The steeper the segment, the bigger the change in units.
Steepest is not always the largest percent
April to May: +9 on 45 = 20%. May to June: +6 on 54 ≈ 11.1%. February to March: +6 on 44 ≈ 13.6%.
Here the steepest segment also has the largest percentage, but always check: a smaller base can win.
Two lines on one graph
With two lines, look for the gap (difference) and the crossing (equal values). Count years where one line is above the other.
Profit-percent line graphs
Bank exams often plot profit % = (I − E) ÷ E × 100. The graph alone gives no rupees.
If profit is 25% and expenditure is ₹80 lakh, income = 80 × 1.25 = ₹100 lakh. If income is ₹150 lakh at 20% profit, expenditure = 150 ÷ 1.2 = ₹125 lakh.
Back to Anjali
Food ₹14,400; rent is 4 : 3 against savings; education is 54°. And if her app also showed a line of savings month by month, she would read its trend and steepest rise the same way.
Pie: share of a whole. Line: change over time. Convert, compare, and keep an eye on the base.
Concepts and terms
Sector and central angle
Each slice of a pie is a sector; its angle at the centre is its share of 360°.
Proportion between sectors
Amounts are in the same ratio as the slices, so a known slice gives every other slice.
Trend in a line graph
Rising segments mean growth, falling ones decline; the steepness shows how fast.
Percentage profit graph
Plots (I − E) ÷ E × 100. It tells the rate, not the amount; you need I or E to get rupees.
Did you know
Florence Nightingale used a pie-like “rose diagram” in 1858 to show that more soldiers died of disease than of wounds.
The Union Budget’s “rupee comes from, rupee goes to” pictures are pie charts of one rupee.
Memory tricks
Percent to degrees — Three-point-six is the magic mix — Multiply a percentage by 3.6 to get degrees; divide degrees by 3.6 to get the percentage.
Common angles — 90 is a quarter, 36 is a tenth, 18 is a twentieth — 90° = 25%, 36° = 10%, 18° = 5%, 72° = 20%, 54° = 15%.
Practice MCQs with answers (61)
Q1
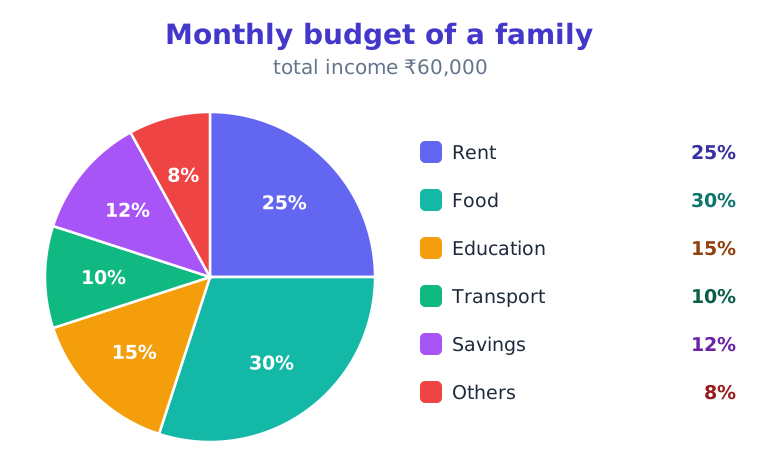
How much does the family spend on Food (in ₹)?
beginner
A9,000
B18,000
C19,800
D5,000
Show answer
Answer: 18,000
Why:
30% of 60,000 = 60,000 × 30 ÷ 100 = 18,000.
Q2
What is the central angle of the sector for Education?

beginner
A72°
B15°
C54°
D27°
Show answer
Answer: 54°
Why:
15% of 360° = 15 × 3.6 = 54°.
Q3
What is the difference between Rent and Savings (in ₹)?

intermediate
A15,000
B15,600
C22,200
D7,800
Show answer
Answer: 7,800
Why:
Subtract the slices first: 25% − 12% = 13%. Then 13% of 60,000 = 7,800.
Q4
Food is what percentage more than Rent?

intermediate
A20%
B120%
C16.67%
D5%
Show answer
Answer: 20%
Why:
(30 − 25) ÷ 25 × 100 = 20%. The base is the one after “than”.
Q5
What is the combined value of Education and Transport (in ₹)?

intermediate
A9,000
B15,000
C18,000
D3,000
Show answer
Answer: 15,000
Why:
Add the slices: 15% + 10% = 25%; 25% of 60,000 = 15,000.
Q6
How many students study Science?
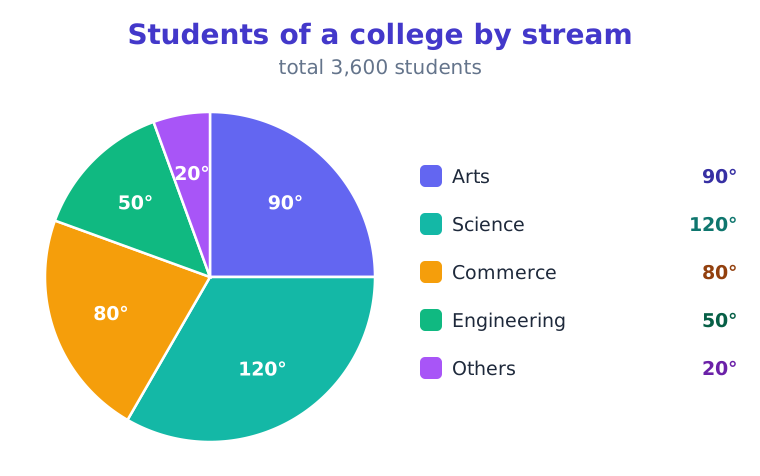
beginner
A1,320
B4,320
C1,200
D800
Show answer
Answer: 1,200
Why:
120 ÷ 360 × 3,600 = 1,200.
Q7
What percentage of the whole does Commerce make up (correct to two decimal places)?

intermediate
A80%
B26.67%
C27.22%
D22.22%
Show answer
Answer: 22.22%
Why:
80° ÷ 360° × 100 = 22.22%.
Q8
What is the difference between Science and Arts?

intermediate
A300
B2,100
C1,200
D600
Show answer
Answer: 300
Why:
Subtract the slices first: 120° − 90° = 30°. Then 30° of 3,600 = 300.
Q9
What is the ratio of Arts to Engineering?

beginner
A14 : 5
B9 : 5
C5 : 9
D9 : 2
Show answer
Answer: 9 : 5
Why:
The total cancels, so compare the slices: 90 : 50 = 9 : 5.
Q10
Arts is what percentage more than Commerce?

advanced
A10%
B112.5%
C12.5%
D11.11%
Show answer
Answer: 12.5%
Why:
(90 − 80) ÷ 80 × 100 = 12.5%. The base is the one after “than”.
Q11
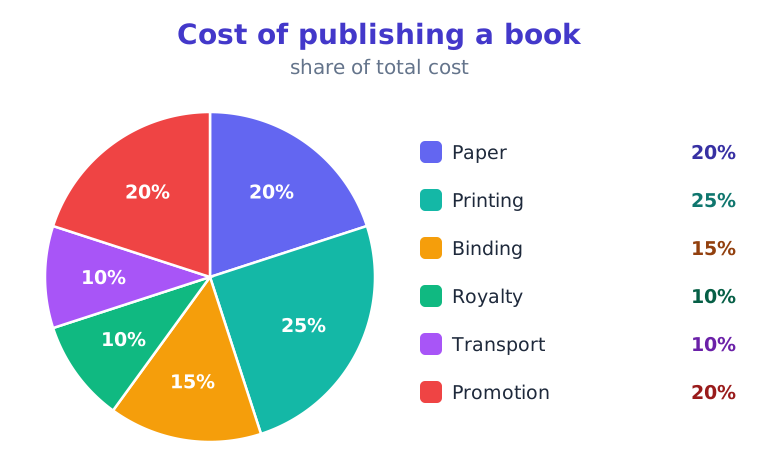
If Royalty comes to ₹30,000, what does Printing come to (in ₹)?
intermediate
A3,00,000
B12,000
C78,000
D75,000
Show answer
Answer: 75,000
Why:
Slices are in proportion: 30,000 × 25 ÷ 10 = 75,000. No need to find the total.
Q12
If Royalty comes to ₹30,000, what is the total (in ₹)?

intermediate
A3,00,000
B2,70,000
C3,30,000
D10,80,000
Show answer
Answer: 3,00,000
Why:
10% of the total = 30,000, so total = 30,000 × 100 ÷ 10 = 3,00,000.
Q13
What is the central angle of the sector for Promotion?

beginner
A20°
B72°
C36°
D90°
Show answer
Answer: 72°
Why:
20% of 360° = 20 × 3.6 = 72°.
Q14
What is the ratio of Paper to Printing?

beginner
A5 : 4
B4 : 3
C4 : 5
D9 : 5
Show answer
Answer: 4 : 5
Why:
The total cancels, so compare the slices: 20 : 25 = 4 : 5.
Q15
Printing is what percentage more than Binding (correct to two decimal places)?

advanced
A166.67%
B40%
C10%
D66.67%
Show answer
Answer: 66.67%
Why:
(25 − 15) ÷ 15 × 100 = 66.67%. The base is the one after “than”.
Q16
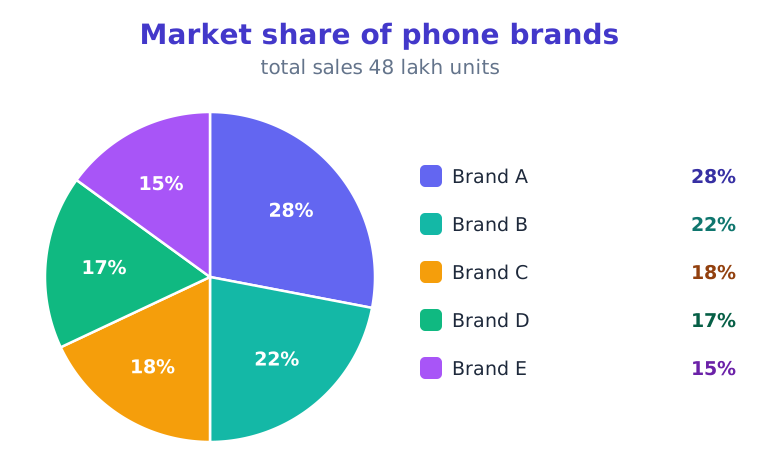
How many phones did Brand A sell (in lakh units)?
intermediate
A13.44
B3.73
C10.56
D14.78
Show answer
Answer: 13.44
Why:
28% of 48 = 48 × 28 ÷ 100 = 13.44.
Q17
What is the difference between Brand B and Brand E (in lakh units)?

intermediate
A17.76
B3.36
C10.56
D6.72
Show answer
Answer: 3.36
Why:
Subtract the slices first: 22% − 15% = 7%. Then 7% of 48 = 3.36.
Q18
What is the ratio of Brand C to Brand E?

beginner
A5 : 6
B9 : 14
C6 : 5
D11 : 5
Show answer
Answer: 6 : 5
Why:
The total cancels, so compare the slices: 18 : 15 = 6 : 5.
Q19
What is the central angle of the sector for Brand D?

advanced
A17°
B30.6°
C79.2°
D61.2°
Show answer
Answer: 61.2°
Why:
17% of 360° = 17 × 3.6 = 61.2°.
Q20
What is the combined value of Brand D and Brand E (in lakh units)?

beginner
A15.36
B8.16
C17.76
D0.96
Show answer
Answer: 15.36
Why:
Add the slices: 17% + 15% = 32%; 32% of 48 = 15.36.
Q21
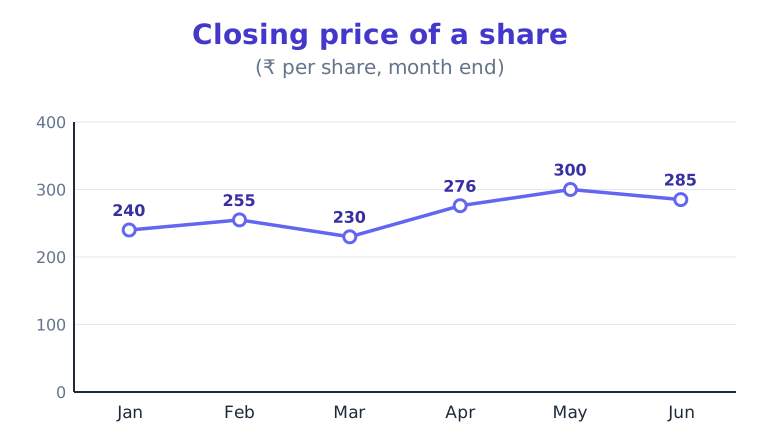
By what percentage did the share price rise from Mar to Apr?
intermediate
A16.67%
B20%
C120%
D46%
Show answer
Answer: 20%
Why:
Change = 276 − 230 = +46. Percentage change = 46 ÷ 230 × 100 = 20%. The base is the older value, 230.
Q22
In which month did the share price show the highest percentage increase over the previous month?

advanced
AFeb
BJun
CApr
DMay
Show answer
Answer: Apr
Why:
Percentage change each month: Feb: 6.25%, Mar: -9.8%, Apr: 20%, May: 8.7%, Jun: -5%. The biggest is Apr. (The biggest jump in units is not always the biggest percentage.)
Q23
What is the average share price per month (in ₹) (correct to two decimal places)?

intermediate
Q24
By what percentage did the share price fall from Feb to Mar (correct to two decimal places)?

intermediate
A9.8%
B90.2%
C25%
D10.87%
Show answer
Answer: 9.8%
Why:
Change = 230 − 255 = −25. Percentage change = 25 ÷ 255 × 100 = 9.8%. The base is the older value, 255.
Q25
What is the ratio of the share price in Jan to the share price in May?

beginner
A16 : 19
B4 : 5
C19 : 20
D5 : 4
Show answer
Answer: 4 : 5
Why:
240 : 300; divide both by 60 to get 4 : 5.
Q26
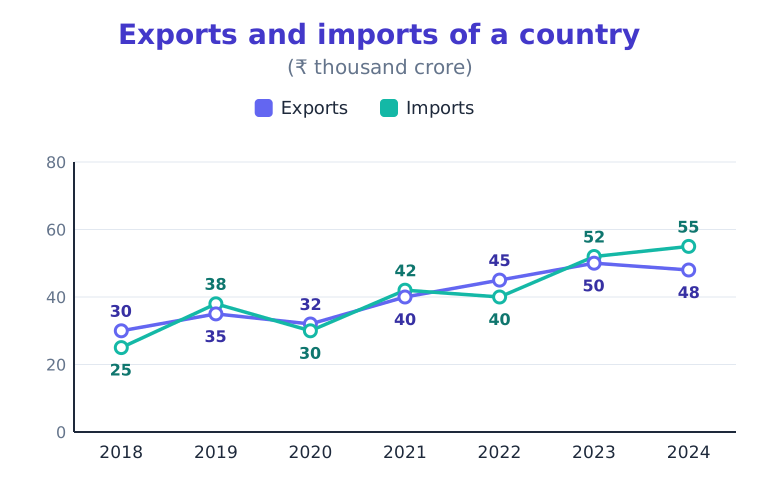
In how many years did the exports exceed the imports?
intermediate
A5
B4
C3
D2
Show answer
Answer: 3
Why:
The Exports line is above the Imports line in: 2018, 2020, 2022. That is 3.
Q27
In which year was the gap between the exports and the imports the widest?

intermediate
Q28
What is the ratio of the total exports to the total imports over all the years?

advanced
Q29
By what percentage did the imports rise from 2018 to 2024?

advanced
A220%
B120%
C30%
D54.55%
Show answer
Answer: 120%
Why:
Change = 55 − 25 = +30. Percentage change = 30 ÷ 25 × 100 = 120%. The base is the older value, 25.
Q30
In 2022, express the exports as a percentage of the imports.

intermediate
A11.11%
B88.89%
C112.5%
D12.5%
Show answer
Answer: 112.5%
Why:
45 ÷ 40 × 100 = 112.5%.
Q31
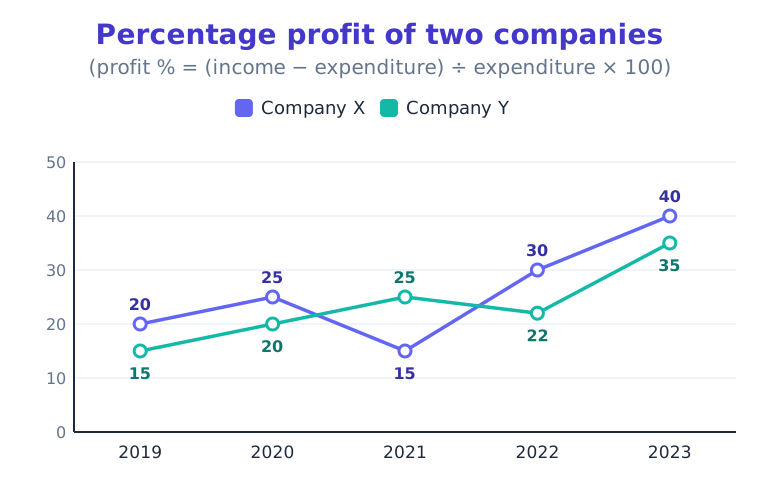
If the expenditure of Company X in 2021 was ₹80 lakh, what was its income (in ₹ lakh)?
intermediate
A95
B12
C94.12
D92
Show answer
Answer: 92
Why:
Profit was 15%, so income = 80 × (100 + 15) ÷ 100 = 92.
Q32
If the income of Company Y in 2023 was ₹270 lakh, what was its expenditure (in ₹ lakh)?

advanced
A200
B235
C364.5
D175.5
Show answer
Answer: 200
Why:
Income = expenditure × (100 + 35) ÷ 100, so expenditure = 270 × 100 ÷ 135 = 200. Taking 35% off the income is the trap.
Q33
In which year was the gap between the profit % of company X and the profit % of company Y the widest?

intermediate
Q34
In 2020 the two companies had equal expenditure. What was the ratio of the income of Company X to that of Company Y?

advanced
A24 : 25
B15 : 16
C25 : 24
D5 : 4
Show answer
Answer: 25 : 24
Why:
Take expenditure 100 for both: incomes 125 and 120, so 25 : 24. The profit ratio 25 : 20 is the trap.
Q35
What is the average profit percentage of company X per year?

beginner
A21.67
B25
C32.5
D26
Show answer
Answer: 26
Why:
Total = 20 + 25 + 15 + 30 + 40 = 130. Average = 130 ÷ 5 = 26.
Q36
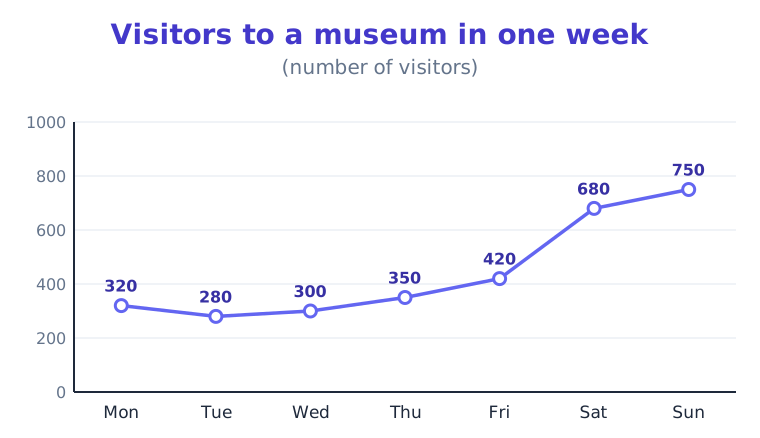
What is the average number of visitors per day (correct to two decimal places)?
intermediate
Q37
On how many days was the number of visitors above the average for all the days?

beginner
A3
B2
C1
D5
Show answer
Answer: 2
Why:
Average = 3,100 ÷ 7 = 442.86. Above it: Sat, Sun, so 2.
Q38
By what percentage did the number of visitors rise from Fri to Sat (correct to two decimal places)?

intermediate
A260%
B38.24%
C61.9%
D161.9%
Show answer
Answer: 61.9%
Why:
Change = 680 − 420 = +260. Percentage change = 260 ÷ 420 × 100 = 61.9%. The base is the older value, 420.
Q39
What is the ratio of the number of visitors on Mon to the number of visitors on Sun?

beginner
A75 : 32
B1 : 1
C107 : 75
D32 : 75
Show answer
Answer: 32 : 75
Why:
320 : 750; divide both by 10 to get 32 : 75.
Q40
What percentage of the week’s visitors came on Saturday and Sunday together (correct to two decimal places)?

advanced
Q41
A sector of a pie chart shows 35% of the total. What is its central angle?
beginner
A105°
B126°
C140°
D144°
Show answer
Answer: 126°
Why:
35 × 3.6 = 126°.
Q42
A sector of a pie chart shows 12.5% of the total. What is its central angle?
intermediate
A63°
B37.5°
C45°
D50°
Show answer
Answer: 45°
Why:
12.5 × 3.6 = 45°.
Q43
A sector of a pie chart shows 8% of the total. What is its central angle?
beginner
A46.8°
B24°
C32°
D28.8°
Show answer
Answer: 28.8°
Why:
8 × 3.6 = 28.8°.
Q44
A sector of a pie chart shows 42% of the total. What is its central angle?
advanced
A151.2°
B169.2°
C126°
D168°
Show answer
Answer: 151.2°
Why:
42 × 3.6 = 151.2°.
Q45
A sector of a pie chart has a central angle of 81°. What percentage of the whole is it?
intermediate
A27%
B22.5%
C20.25%
D27.5%
Show answer
Answer: 22.5%
Why:
81 ÷ 3.6 = 22.5%.
Q46
A sector of a pie chart has a central angle of 144°. What percentage of the whole is it?
beginner
A45%
B48%
C40%
D36%
Show answer
Answer: 40%
Why:
144 ÷ 3.6 = 40%.
Q47
A sector of a pie chart has a central angle of 27°. What percentage of the whole is it?
advanced
A9%
B6.75%
C12.5%
D7.5%
Show answer
Answer: 7.5%
Why:
27 ÷ 3.6 = 7.5%.
Q48
In a pie chart of a total of 7,20,000, the sector for education is 54°. What value does it stand for?
intermediate
A1,08,000
B3,88,800
C1,18,800
D1,28,000
Show answer
Answer: 1,08,000
Why:
54 ÷ 360 × 7,20,000 = 1,08,000.
Q49
In a pie chart of a total of 1,800, the sector for cricket fans is 140°. What value does it stand for?
intermediate
A2,520
B700
C770
D750
Show answer
Answer: 700
Why:
140 ÷ 360 × 1,800 = 700.
Q50
In a pie chart of a total of 96,000, the sector for fuel is 75°. What value does it stand for?
advanced
A72,000
B22,000
C20,000
D22,666.67
Show answer
Answer: 20,000
Why:
75 ÷ 360 × 96,000 = 20,000.
Q51
In a pie chart of a family’s spending, rent has a central angle of 72° and comes to ₹12,000. What is the total spending?
intermediate
A48,000
B72,000
C16,666
D60,000
Show answer
Answer: 60,000
Why:
Total = 12,000 × 360 ÷ 72 = 60,000.
Q52
In a pie chart of a family’s spending, rent has a central angle of 45° and comes to ₹9,000. What is the total spending?
advanced
A72,000
B20,000
C36,000
D81,000
Show answer
Answer: 72,000
Why:
Total = 9,000 × 360 ÷ 45 = 72,000.
Q53
Which chart is best for showing how a share price moved over 12 months?
beginner
AA pie chart
BA line graph
CA stacked bar of one month
DA table of brand shares
Show answer
Answer: A line graph
Why:
A line joins values in time order and shows the trend.
Q54
The percentages in a pie chart add up to
beginner
A360
B180
C100
DAny value
Show answer
Answer: 100
Why:
A pie is one whole: 100% or 360°.
Q55
In company P’s pie, 30% is wages; in company Q’s pie, 25% is wages. Which is true?
intermediate
AQ pays more in wages
BBoth pay the same
CP pays more in wages
DWe cannot tell who pays more without the two totals
Show answer
Answer: We cannot tell who pays more without the two totals
Why:
Percentages of different totals cannot be compared as amounts.
Q56
On a line graph, the segment from March to April is the steepest upward segment. What does this tell you for sure?
advanced
AThe rise in units was the largest from March to April
BApril had the highest value of the year
CMarch had the lowest value
DThe percentage rise was the largest
Show answer
Answer: The rise in units was the largest from March to April
Why:
Steepness measures change in units. The percentage depends on the base too.
Q57
A company’s profit % is 25% and its income is ₹150 lakh. What is its expenditure?
intermediate
A₹125 lakh
B₹120 lakh
C₹187.5 lakh
D₹112.5 lakh
Show answer
Answer: ₹120 lakh
Why:
E = 150 ÷ 1.25 = 120. Taking 25% off 150 (112.5) is the trap.
Q58
Assertion (A): In a pie chart, the ratio of two sectors’ amounts equals the ratio of their central angles.
Reason (R): Each amount is its angle ÷ 360 times the same total.
intermediate
ABoth A and R are true, and R is the correct explanation of A
BBoth A and R are true, but R is not the correct explanation of A
CA is true but R is false
DA is false but R is true
Show answer
Answer: Both A and R are true, and R is the correct explanation of A
Why:
Both true; the common factor total ÷ 360 cancels, which is why A holds.
Q59
Assertion (A): A line graph of profit % rising every year means the profit in rupees also rose every year.
Reason (R): Profit % depends on both income and expenditure.
advanced
ABoth A and R are true, and R is the correct explanation of A
BBoth A and R are true, but R is not the correct explanation of A
CA is true but R is false
DA is false but R is true
Show answer
Answer: A is false but R is true
Why:
A is false: if expenditure falls, rupee profit can fall while the rate rises. R is true.
Q60
In a pie chart, education has 54° and transport has 36°. Consider:
1. Education is 15% of the total.
2. Education is 50% more than transport.
intermediate
A1 only
B2 only
CBoth 1 and 2
DNeither 1 nor 2
Show answer
Answer: Both 1 and 2
Why:
54 ÷ 3.6 = 15%; (54 − 36) ÷ 36 = 50%. Both true.
Q61
Two lines on a graph cross in 2021. Consider:
1. The two values were equal in 2021.
2. Both values were at their highest in 2021.
beginner
A1 only
B2 only
CBoth 1 and 2
DNeither 1 nor 2
Show answer
Answer: 1 only
Why:
Crossing means equal. It says nothing about being the highest.
Important short questions (4)
In a pie chart of ₹2,40,000, travel has 48°. Find the amount for travel.
48 ÷ 360 × 2,40,000 = ₹32,000.
Food is 32% and rent is 24% of a budget. Rent is ₹9,000. Find food and the total.
Why can two pie charts not be compared by percentages alone?
Each percentage is of its own total. 20% of 1,000 is 200, but 15% of 2,000 is 300.
Long answer questions (1)
A pie chart shows a city’s waste: kitchen 40%, plastic 18%, paper 22%, metal 8%, others 12%. The city makes 1,500 tonnes a day. (a) Find the tonnes of plastic. (b) Find the central angle for paper. (c) If plastic is cut by one third and the saving is not replaced, what share of the new total is plastic?
Can you compare 30% of one pie with 25% of another?
Only after converting both to amounts
Best chart for a share of a budget?
Pie chart
Play this topic
Pie and line check
Caselets and Mixed Graphs
Turn a paragraph of data (a caselet) into a table, handle “percent of the rest” chains and Venn-type overlaps, and combine two charts, such as a pie of totals with a table of rates, the way Bank Mains DI sets do.
What you will be able to do
I can convert a caselet paragraph into a table and fill its missing cells.
I can solve “percent of the remaining” chains without mixing up the base.
I can use only, both and neither counts in a two-group survey.
I can combine two charts, such as totals in one and rates in another.
Key points
A caselet is DI without a picture: draw the table yourself before answering.
Mark what each percentage is of: “40% of the girls” and “40% of the students” are very different.
In a chain, each step works on what is left: after 30% rent, 25% of the rest is 25% of 70%.
Two groups: total = only A + only B + both + neither.
n(A or B) = n(A) + n(B) − n(both).
In mixed graphs, one chart usually gives totals and the other gives rates; multiply them first.
A ratio a : b of a group of N splits it into N × a ÷ (a + b) and N × b ÷ (a + b).
Two pies with different totals: convert each slice to an amount before comparing.
Check your table: rows and columns must add up to the totals given in the caselet.
Full explanation
Priya’s coaching batch
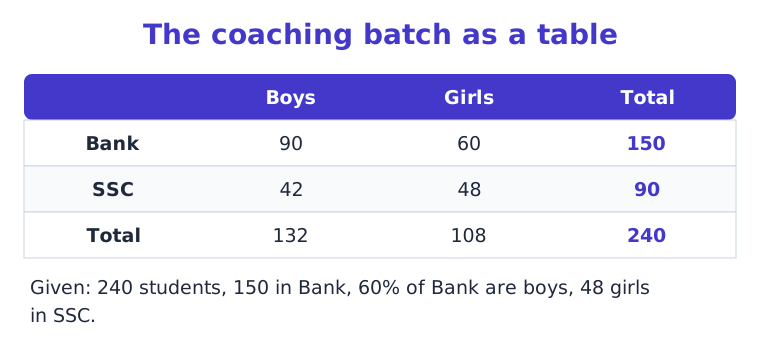
Priya’s coaching centre sends a message: “Our batch has 240 students. 150 are preparing for Bank exams and the rest for SSC. 60% of the Bank students are boys. There are 48 girls preparing for SSC.”
How many boys are preparing for SSC? There is no chart, only a paragraph. This is a caselet.
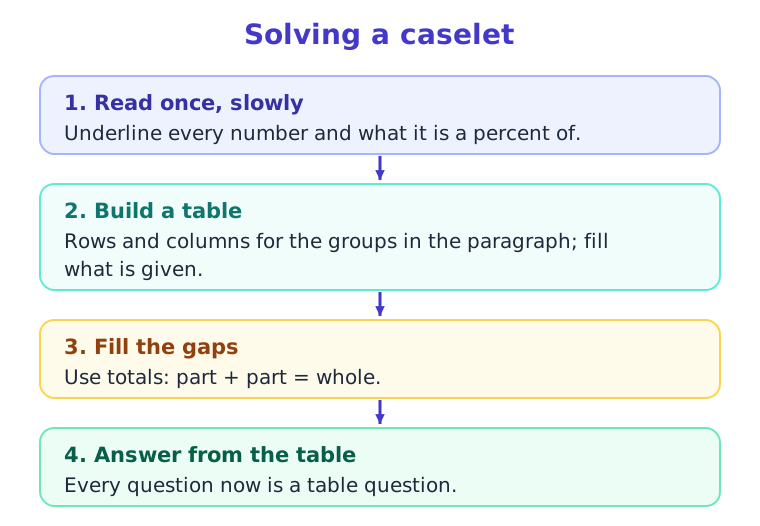
A caselet hides a table
Do not answer from the words. Draw the table first, then every question becomes a table question.
Filling Priya’s table
Bank = 150, so SSC = 240 − 150 = 90. Bank boys = 60% of 150 = 90, Bank girls = 60. SSC girls = 48, so SSC boys = 90 − 48 = 42.
Percent of the rest
A salary of ₹50,000: 30% on rent, then 40% of the remaining on food, then 25% of what is left on travel, and the rest is saved.
After rent: 35,000. Food = 40% of 35,000 = 14,000, leaving 21,000. Travel = 25% of 21,000 = 5,250. Savings = ₹15,750.
In one line: 50,000 × 0.7 × 0.6 × 0.75 = 15,750.
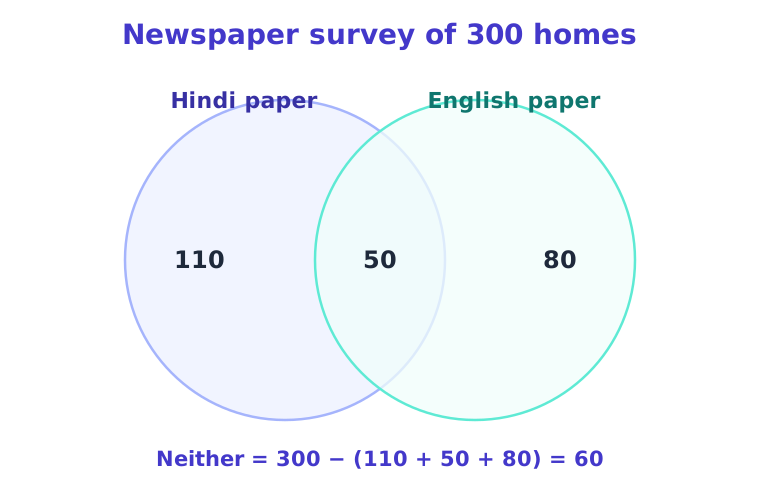
Overlapping groups
In a survey of 300 homes, 160 read a Hindi paper, 130 read an English paper and 50 read both.
Only Hindi = 160 − 50 = 110, only English = 130 − 50 = 80. At least one = 110 + 50 + 80 = 240. Neither = 300 − 240 = 60.
Mixed graphs: total × rate
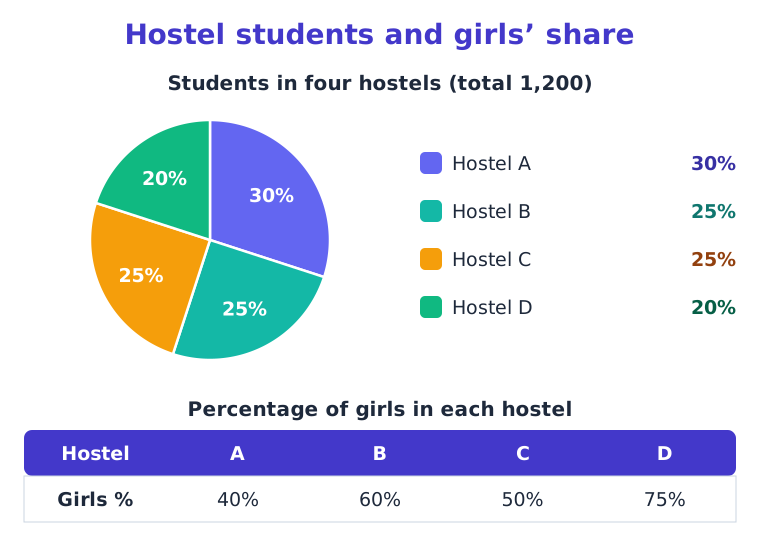
One chart gives how many students are in each hostel; the other gives the percentage of girls. Hostel D has 20% of 1,200 = 240 students, and 75% of them are girls: 180 girls.
Always ask: which chart gives the total, and which gives the rate?
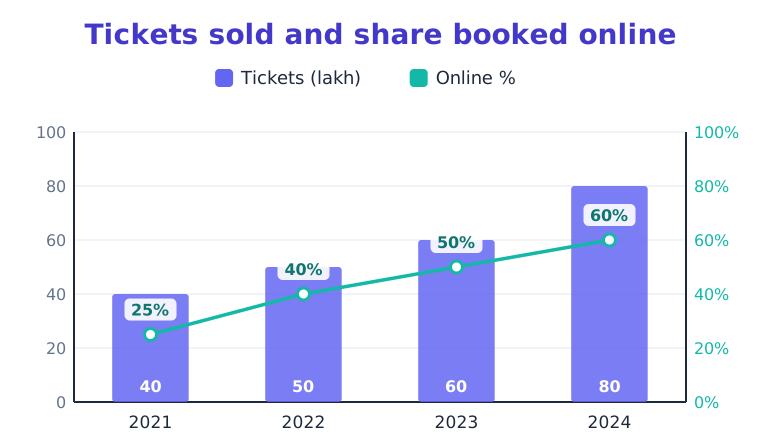
Bars with a line
Here the bars are tickets sold (lakh) and the line is the share booked online. Online tickets in 2024 = 60% of 80 = 48 lakh; in 2021, 25% of 40 = 10 lakh.
The line is a rate, so it only means something after you multiply it by the bar.
The overall-rate trap
School P: 200 students, 90% pass. School Q: 800 students, 60% pass. The overall pass rate is not (90 + 60) ÷ 2 = 75%.
Passed = 180 + 480 = 660 of 1,000, so it is 66%. The bigger school pulls the overall rate towards its own.
Back to Priya
42 boys prepare for SSC. Priya did not need a chart: she built one. Caselets, chains, overlaps and mixed graphs all reduce to the same habit: a clean table, totals that add up, and the right base for every percent.
Concepts and terms
Caselet
A short paragraph that hides a table of data. Bank Mains sets often give 5 questions on one caselet.
Remainder chain
Percentages applied one after another on what is left: S × (1 − a) × (1 − b) × …
Two-set overlap
People in both groups are counted once in “A or B”: n(A) + n(B) − n(both).
Mixed graph
Two charts on one data set, for example sales in bars and the online share as a line. Answers need both.
Overall rate
The overall pass % is total passed ÷ total appeared, not the average of the separate rates.
Did you know
SBI PO and IBPS PO Mains papers regularly include caselet DI sets, and they are often the longest questions on the paper.
John Venn introduced his overlapping circles in 1880 to picture logic, not counting.
Memory tricks
Caselet method — Read, Table, Fill, Answer (RTFA) — Never answer straight from the paragraph; build the table first.
Overlap — Add both, take the double once — n(A) + n(B) counts the overlap twice, so subtract it once.
Practice MCQs with answers (65)
Q1
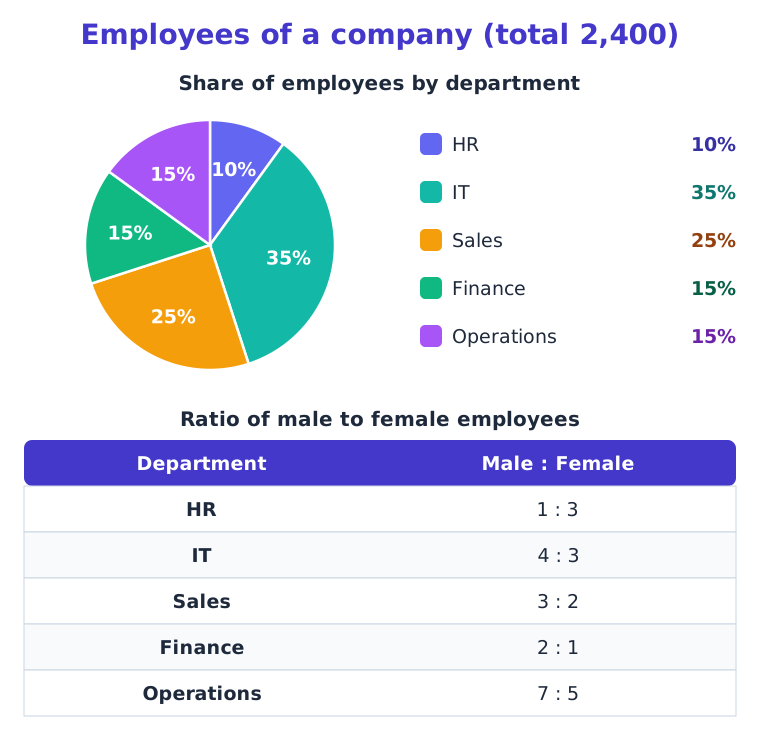
How many female employees work in IT?
beginner
A240
B480
C360
D840
Show answer
Answer: 360
Why:
IT = 35% of 2,400 = 840. Females = 840 × 3 ÷ 7 = 360.
Q2
What is the total number of male employees in the company?

intermediate
A1,290
B1,410
C1,050
D1,350
Show answer
Answer: 1,350
Why:
Males: 60 + 480 + 360 + 240 + 210 = 1350.
Q3
What is the ratio of female employees in Sales to male employees in Operations?

intermediate
Q4
Female employees in Finance are what percentage of all female employees (correct to two decimal places)?

advanced
Q5
By what percentage is the number of male employees in IT more than that in Sales (correct to two decimal places)?

intermediate
Q6
What were the online sales in 2022 (in ₹ crore)?
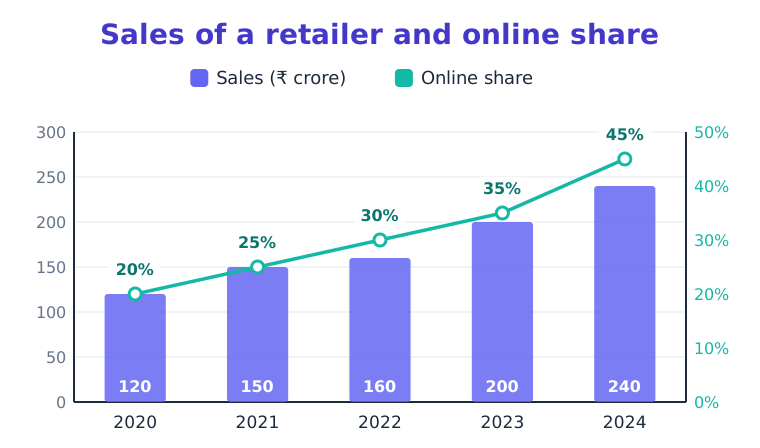
beginner
A112
B70
C30
D48
Show answer
Answer: 48
Why:
30% of 160 = 48.
Q7
What were the offline sales in 2024 (in ₹ crore)?

intermediate
A132
B130
C195
D108
Show answer
Answer: 132
Why:
Offline share = 100 − 45 = 55%; 55% of 240 = 132.
Q8
By what percentage did online sales grow from 2020 to 2024?

advanced
A77.78%
B350%
C25%
D125%
Show answer
Answer: 350%
Why:
Online 2020 = 20% of 120 = 24; 2024 = 45% of 240 = 108. Growth = 84 ÷ 24 × 100 = 350%. The share went up 125%, but the amount went up far more because total sales doubled too.
Q9
What were the total online sales over the five years (in ₹ crore)?

intermediate
A582.5
B155
C287.5
D263.5
Show answer
Answer: 287.5
Why:
24 + 37.5 + 48 + 70 + 108 = 287.5.
Q10
In which year did offline sales fall compared with the year before?

advanced
A2023
B2024
C2021
D2022
Show answer
Answer: 2022
Why:
Offline sales: 2020 96, 2021 112.5, 2022 112, 2023 130, 2024 132. Only 2022 is lower than the year before, even though total sales rose.
Q11
How many students passed in all five schools together?
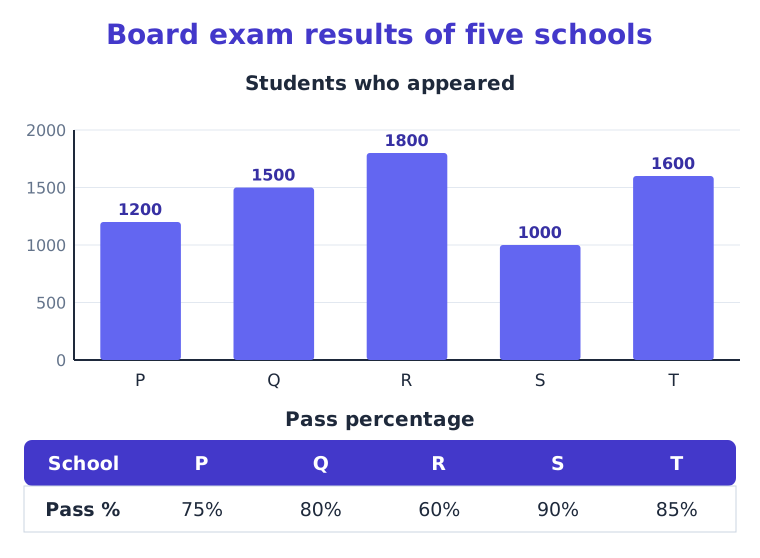
intermediate
A5,440
B1,660
C4,540
D7,100
Show answer
Answer: 5,440
Why:
Passed: 900 + 1200 + 1080 + 900 + 1360 = 5,440.
Q12
Which school had the largest number of students who failed?

intermediate
AQ
BR
CT
DP
Show answer
Answer: R
Why:
Failed: P 300, Q 300, R 720, S 100, T 240. Most: R.
Q13
What is the ratio of students who passed in school Q to those who passed in school R?

intermediate
A5 : 6
B4 : 3
C10 : 9
D9 : 10
Show answer
Answer: 10 : 9
Why:
Q: 80% of 1500 = 1200; R: 60% of 1800 = 1080; ratio = 10 : 9.
Q14
What is the overall pass percentage of the five schools taken together (correct to two decimal places)?

advanced
A73.62%
B78%
C78.62%
D76.62%
Show answer
Answer: 76.62%
Why:
Passed 5440 of 7100: 5440 ÷ 7100 × 100 = 76.62%. The plain average of the five rates (78%) is the trap.
Q15
How many students failed in school T?

beginner
A240
B15
C100
D1,360
Show answer
Answer: 240
Why:
Fail % = 100 − 85 = 15%; 15% of 1600 = 240.
Q16
How many cars did Brand B sell in 2024?
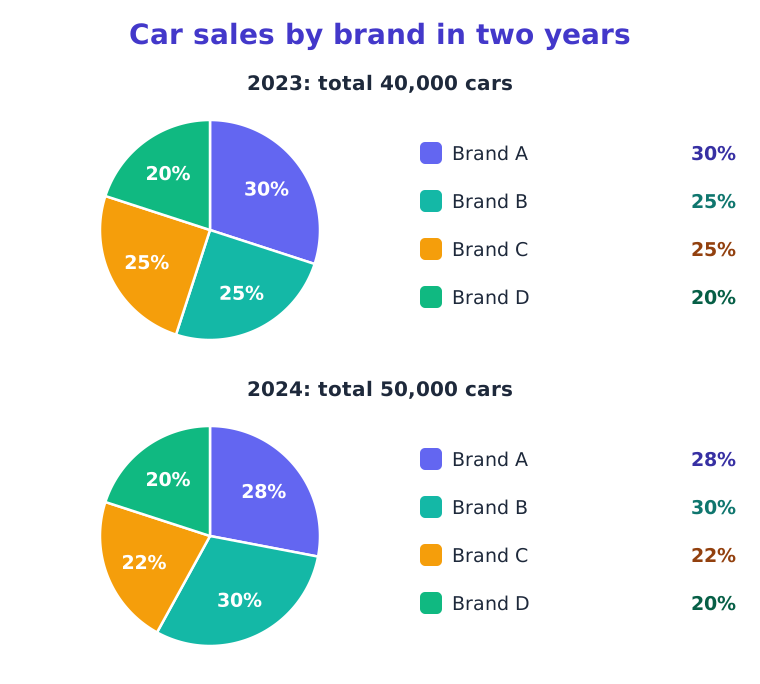
beginner
A14,000
B15,000
C10,000
D13,000
Show answer
Answer: 15,000
Why:
30% of 50,000 = 15,000.
Q17
By what percentage did Brand A’s sales change from 2023 to 2024 (correct to two decimal places)?

intermediate
A6.67%
B14.29%
C16.67%
D25%
Show answer
Answer: 16.67%
Why:
2023: 30% of 40,000 = 12000; 2024: 28% of 50,000 = 14000. Rise = 2000 ÷ 12000 × 100 = 16.67% increase. Its share fell, yet its sales rose.
Q18
Which brand had the highest percentage growth in sales from 2023 to 2024?

intermediate
ABrand C
BBrand D
CBrand A
DBrand B
Show answer
Answer: Brand B
Why:
Growth: Brand A 16.67%, Brand B 50%, Brand C 10%, Brand D 25%.
Q19
How many cars did Brand C sell in the two years together?

beginner
A21,000
B42,300
C20,000
D22,000
Show answer
Answer: 21,000
Why:
10000 + 11000 = 21,000.
Q20
What is the ratio of Brand D’s sales in 2023 to its sales in 2024?

intermediate
A5 : 4
B4 : 5
C2 : 3
D1 : 1
Show answer
Answer: 4 : 5
Why:
Same 20% share, different totals: 8000 : 10000 = 4 : 5. “1 : 1” is the trap.
Q21
What was the firm’s total monthly salary bill in 2021 (in ₹ thousand)?
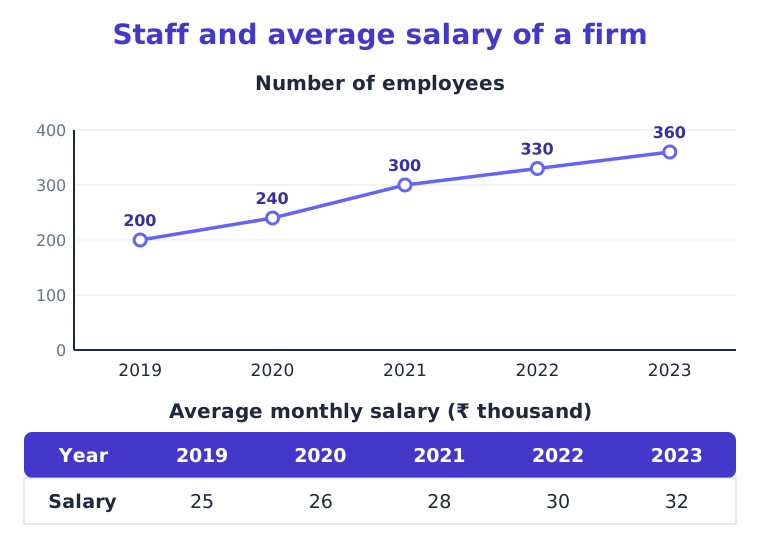
intermediate
A7,800
B328
C8,400
D6,240
Show answer
Answer: 8,400
Why:
300 employees × ₹28 thousand = 8,400.
Q22
By what percentage did the number of employees rise from 2019 to 2023?

beginner
A44.44%
B160%
C28%
D80%
Show answer
Answer: 80%
Why:
(360 − 200) ÷ 200 × 100 = 80%.
Q23
By what percentage did the monthly salary bill rise from 2019 to 2023 (correct to two decimal places)?

advanced
A130.4%
B56.6%
C140.4%
D108%
Show answer
Answer: 130.4%
Why:
Bills: 5000 and 11520. (11520 − 5000) ÷ 5000 × 100 = 130.4%. Adding the two growth rates (80% + 28%) is the trap.
Q24
In which year did the monthly salary bill first go above ₹9,000 thousand?

intermediate
Q25
By how much did the monthly salary bill increase from 2022 to 2023 (in ₹ thousand)?

intermediate
Q26
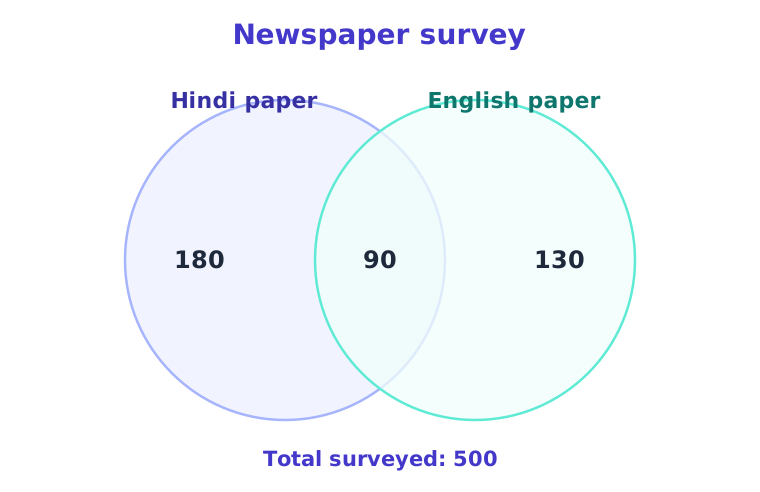
How many of the 500 people are in neither group?
intermediate
A190
B10
C110
D100
Show answer
Answer: 100
Why:
At least one = 180 + 90 + 130 = 400; neither = 500 − 400 = 100.
Q27
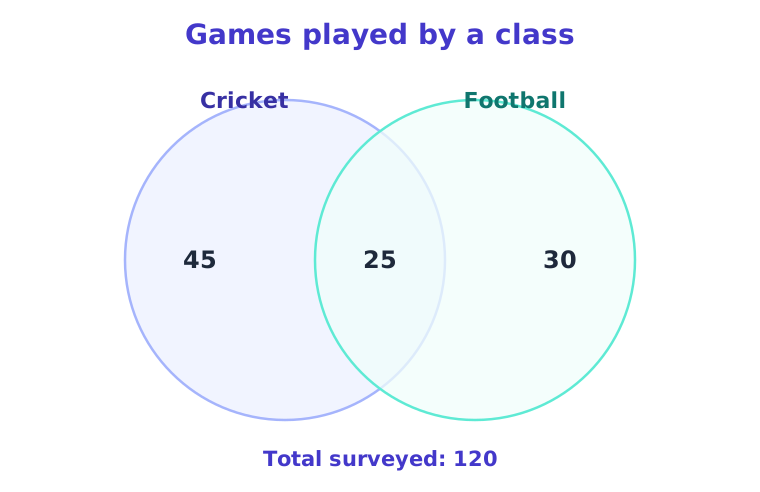
What percentage of the 120 people are in exactly one group?
advanced
Q28
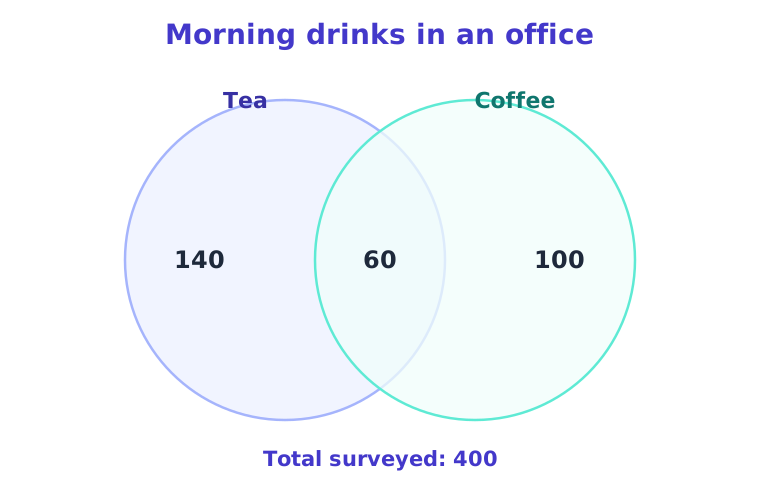
How many of the 400 people are in at most one of the two groups?
advanced
A100
B340
C240
D300
Show answer
Answer: 340
Why:
At most one = everyone except “both” = 400 − 60 = 340.
Q29
A school has 1200 students, of whom 45% are girls. 40% of the girls and 60% of the boys play a sport. How many boys play a sport?
beginner
A216
B720
C396
D264
Show answer
Answer: 396
Why:
Boys = 1200 − 540 = 660; 60% of 660 = 396.
Q30
A school has 1200 students, of whom 45% are girls. 40% of the girls and 60% of the boys play a sport. How many students in all play a sport?
intermediate
A588
B600
C876
D612
Show answer
Answer: 612
Why:
Girls 40% of 540 = 216; boys 60% of 660 = 396; total 612.
Q31
A school has 1200 students, of whom 45% are girls. 40% of the girls and 60% of the boys play a sport. What percentage of the students who play a sport are girls (correct to two decimal places)?
advanced
A35.29%
B18%
C45%
D40%
Show answer
Answer: 35.29%
Why:
Girls who play = 216, all who play = 612; 216 ÷ 612 × 100 = 35.29%.
Q32
A school has 800 students, of whom 55% are girls. 20% of the girls and 50% of the boys play a sport. How many girls do not play any sport?
beginner
A88
B352
C180
D532
Show answer
Answer: 352
Why:
Girls = 55% of 800 = 440; not playing = 440 − 88 = 352.
Q33
A school has 800 students, of whom 55% are girls. 20% of the girls and 50% of the boys play a sport. How many students in all play a sport?
intermediate
A448
B532
C268
D280
Show answer
Answer: 268
Why:
Girls 20% of 440 = 88; boys 50% of 360 = 180; total 268.
Q34
A school has 1500 students, of whom 40% are girls. 35% of the girls and 30% of the boys play a sport. What percentage of the students who play a sport are girls (correct to two decimal places)?
advanced
A40%
B35%
C14%
D43.75%
Show answer
Answer: 43.75%
Why:
Girls who play = 210, all who play = 480; 210 ÷ 480 × 100 = 43.75%.
Q35
A school has 1500 students, of whom 40% are girls. 35% of the girls and 30% of the boys play a sport. How many boys play a sport?
intermediate
A270
B450
C630
D210
Show answer
Answer: 270
Why:
Boys = 1500 − 600 = 900; 30% of 900 = 270.
Q36
Mr Verma earns ₹60,000 a month. He spends 25% on rent, 40% of the remaining on food and 20% of what is then left on travel. He saves the rest. How much does he save each month (in ₹)?
intermediate
A27,000
B21,600
C21,100
D9,000
Show answer
Answer: 21,600
Why:
60,000 × 0.75 × 0.6 × 0.8 = 21,600.
Q37
Mr Verma earns ₹60,000 a month. He spends 25% on rent, 40% of the remaining on food and 20% of what is then left on travel. He saves the rest. How much does he spend on food (in ₹)?
beginner
A24,000
B45,000
C18,000
D33,000
Show answer
Answer: 18,000
Why:
After rent: 45,000. Food = 40% of 45,000 = 18,000. Taking 40% of the full salary is the trap.
Q38
Mr Verma earns ₹80,000 a month. He spends 30% on rent, 25% of the remaining on food and 10% of what is then left on travel. He saves the rest. What percentage of his salary does he spend on travel (correct to two decimal places)?
advanced
Q39
Mr Verma earns ₹80,000 a month. He spends 30% on rent, 25% of the remaining on food and 10% of what is then left on travel. He saves the rest. How much does he save each month (in ₹)?
intermediate
A37,800
B37,300
C28,000
D42,000
Show answer
Answer: 37,800
Why:
80,000 × 0.7 × 0.75 × 0.9 = 37,800.
Q40
Mr Verma earns ₹45,000 a month. He spends 20% on rent, 50% of the remaining on food and 30% of what is then left on travel. He saves the rest. How much does he spend on food (in ₹)?
beginner
A36,000
B18,000
C27,000
D22,500
Show answer
Answer: 18,000
Why:
After rent: 36,000. Food = 50% of 36,000 = 18,000. Taking 50% of the full salary is the trap.
Q41
Mr Verma earns ₹45,000 a month. He spends 20% on rent, 50% of the remaining on food and 30% of what is then left on travel. He saves the rest. How much does he save each month (in ₹)?
intermediate
A12,100
B13,860
C12,600
D18,000
Show answer
Answer: 12,600
Why:
45,000 × 0.8 × 0.5 × 0.7 = 12,600.
Q42
Mr Verma earns ₹72,000 a month. He spends 35% on rent, 20% of the remaining on food and 25% of what is then left on travel. He saves the rest. What percentage of his salary does he spend on travel (correct to two decimal places)?
advanced
Q43
A factory has three machines. Machine A makes 600 pieces a day, of which 2% are defective. Machine B makes 400 pieces a day, of which 5% are defective. Machine C makes 500 pieces a day, of which 4% are defective. How many defective pieces are made each day in all?
beginner
A52
B64
C32
D55
Show answer
Answer: 52
Why:
12 + 20 + 20 = 52.
Q44
A factory has three machines. Machine A makes 600 pieces a day, of which 2% are defective. Machine B makes 400 pieces a day, of which 5% are defective. Machine C makes 500 pieces a day, of which 4% are defective. What is the overall defect percentage of the factory (correct to two decimal places)?
advanced
A5%
B3.47%
C4.47%
D3.67%
Show answer
Answer: 3.47%
Why:
Defective 52 of 1500: 52 ÷ 1500 × 100 = 3.47%. Averaging the three rates is the trap.
Q45
A factory has three machines. Machine A makes 1200 pieces a day, of which 1.5% are defective. Machine B makes 800 pieces a day, of which 3% are defective. Machine C makes 1000 pieces a day, of which 2% are defective. What is the overall defect percentage of the factory (correct to two decimal places)?
advanced
A2.17%
B3%
C2.07%
D3.07%
Show answer
Answer: 2.07%
Why:
Defective 62 of 3000: 62 ÷ 3000 × 100 = 2.07%. Averaging the three rates is the trap.
Q46
A factory has three machines. Machine A makes 1200 pieces a day, of which 1.5% are defective. Machine B makes 800 pieces a day, of which 3% are defective. Machine C makes 1000 pieces a day, of which 2% are defective. How many defective pieces are made each day in all?
intermediate
A42
B65
C80
D62
Show answer
Answer: 62
Why:
18 + 24 + 20 = 62.
Q47
A library has 12,000 books. 45% are in Hindi, and the rest are in English and Sanskrit in the ratio 4 : 1. How many books are in Sanskrit?
beginner
Q48
A library has 12,000 books. 45% are in Hindi, and the rest are in English and Sanskrit in the ratio 4 : 1. By how many is the number of Hindi books more than the number of English books?
intermediate
A220
B120
C4,080
D1,200
Show answer
Answer: 120
Why:
Hindi = 5,400, English = 6,600 × 4 ÷ 5 = 5,280; difference = 120.
Q49
A library has 9,000 books. 60% are in Hindi, and the rest are in English and Sanskrit in the ratio 5 : 3. By how many is the number of Hindi books more than the number of English books?
intermediate
A3,250
B4,050
C3,150
D1,800
Show answer
Answer: 3,150
Why:
Hindi = 5,400, English = 3,600 × 5 ÷ 8 = 2,250; difference = 3,150.
Q50
A library has 9,000 books. 60% are in Hindi, and the rest are in English and Sanskrit in the ratio 5 : 3. How many books are in Sanskrit?
intermediate
Q51
A caselet says “40% of the employees are women, and 25% of the women work part-time”. What share of all employees are part-time women?
intermediate
A10%
B15%
C25%
D65%
Show answer
Answer: 10%
Why:
25% of 40% = 0.25 × 40 = 10%.
Q52
Two schools: 300 students with 80% pass and 700 students with 50% pass. The overall pass percentage is
advanced
A55%
B59%
C65%
D62%
Show answer
Answer: 59%
Why:
240 + 350 = 590 of 1,000 = 59%.
Q53
In a survey, n(A) = 70, n(B) = 50 and n(A or B) = 100. How many are in both A and B?
intermediate
A50
B120
C20
D30
Show answer
Answer: 20
Why:
Both = 70 + 50 − 100 = 20.
Q54
A mixed graph gives the number of employees in bars and the percentage of women as a line. To find the number of women in a year you must
beginner
Adivide the line value by the bar
Bread the line value directly
Cadd the bar and the line values
Dmultiply that year’s bar by that year’s percentage
Show answer
Answer: multiply that year’s bar by that year’s percentage
Why:
The bar is the total, the line is the rate: total × rate.
Q55
Assertion (A): Spending 20% and then 30% of the remainder leaves 56% of the money.
Reason (R): Each later percentage is taken of what is left, so the remainders multiply: 0.8 × 0.7.
intermediate
ABoth A and R are true, and R is the correct explanation of A
BBoth A and R are true, but R is not the correct explanation of A
CA is true but R is false
DA is false but R is true
Show answer
Answer: Both A and R are true, and R is the correct explanation of A
Why:
0.8 × 0.7 = 0.56, and R explains why it is not 100 − 50 = 50%.
Q56
Assertion (A): If Brand D has a 20% share in two pie charts, its sales are the same in both years.
Reason (R): A pie chart shows shares of its own total.
advanced
ABoth A and R are true, and R is the correct explanation of A
BBoth A and R are true, but R is not the correct explanation of A
CA is true but R is false
DA is false but R is true
Show answer
Answer: A is false but R is true
Why:
A is false unless the totals are equal; R is true and is exactly why A fails.
Q57
In a survey of 200 people, 120 like tea, 90 like coffee and 40 like both. Consider:
1. 30 people like neither.
2. 130 people like exactly one drink.
advanced
A1 only
B2 only
CBoth 1 and 2
DNeither 1 nor 2
Show answer
Answer: Both 1 and 2
Why:
At least one = 120 + 90 − 40 = 170, neither = 30. Exactly one = 80 + 50 = 130. Both true.
Q58
A caselet: 500 workers, 60% men, and 30% of the men are skilled. Consider:
1. There are 90 skilled men.
2. 30% of all workers are skilled men.
beginner
A1 only
B2 only
CBoth 1 and 2
DNeither 1 nor 2
Show answer
Answer: 1 only
Why:
Men = 300, skilled = 90. 90 of 500 is 18%, not 30%.
Q59
A school has 900 students, of whom 60% are girls. 30% of the girls and 45% of the boys play a sport. How many girls do not play any sport?
beginner
A378
B576
C162
D198
Show answer
Answer: 378
Why:
Girls = 60% of 900 = 540; not playing = 540 − 162 = 378.
Q60
A school has 900 students, of whom 60% are girls. 30% of the girls and 45% of the boys play a sport. What percentage of the students who play a sport are girls (correct to two decimal places)?
advanced
A30%
B50%
C18%
D60%
Show answer
Answer: 50%
Why:
Girls who play = 162, all who play = 324; 162 ÷ 324 × 100 = 50%.
Q61
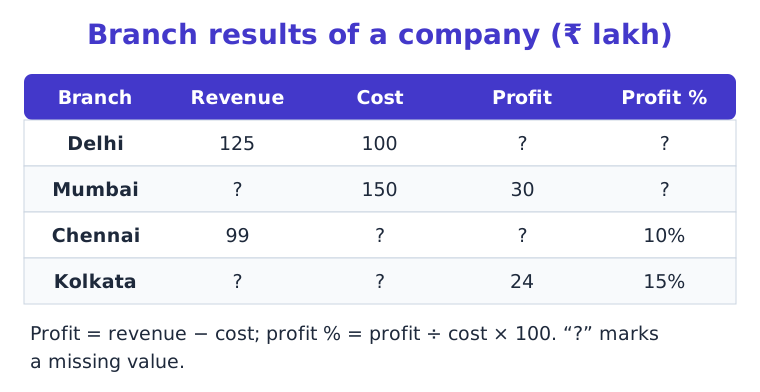
What is the revenue of the Mumbai branch (in ₹ lakh)?
beginner
A120
B185
C180
D150
Show answer
Answer: 180
Why:
Revenue = cost + profit = 150 + 30 = 180.
Q62
What is the cost of the Chennai branch (in ₹ lakh)?

intermediate
A89
B92
C89.1
D90
Show answer
Answer: 90
Why:
Revenue = cost × 1.10, so cost = 99 ÷ 1.1 = 90. Taking 10% off 99 (89.1) is the trap.
Q63
What is the revenue of the Kolkata branch (in ₹ lakh)?

advanced
Q64
What is the total profit of the four branches (in ₹ lakh)?

intermediate
A79
B88
C98
D54
Show answer
Answer: 88
Why:
Profits: 25, 30, 9, 24; total = 88.
Q65
Which branch has the highest profit percentage?

intermediate
AMumbai
BKolkata
CDelhi
DChennai
Show answer
Answer: Delhi
Why:
Profit %: Delhi 25%, Mumbai 20%, Chennai 10%, Kolkata 15%.
Important short questions (4)
A town of 20,000 people: 55% are adults, and 40% of the adults own a two-wheeler. How many adults do not own one?
Adults = 11,000. Without = 60% of 11,000 = 6,600.
₹40,000 is spent as 25% on rent, then 40% of the rest on food. How much is left?
40,000 × 0.75 × 0.6 = ₹18,000.
In a class of 60, 35 like maths, 30 like science and 12 like neither. How many like both?
At least one = 48. Both = 35 + 30 − 48 = 17.
Why is the overall pass % of two schools not the average of their pass percentages?
The schools have different numbers of students. The overall rate is total passed ÷ total appeared, which weights the bigger school more.
Long answer questions (1)
Caselet: A company has 1,800 employees in three offices, Pune, Indore and Patna, in the ratio 5 : 3 : 2. In Pune 40% are women, in Indore 50%, and in Patna 300 are men. (a) Make a table of men and women in each office. (b) What percent of all employees are women? (c) Which office has the highest share of women?
Everything above is on this page to read. In the Veda app the same chapter
becomes spaced-repetition flashcards, timed tests that mark themselves,
Veda Bites you can swipe, and games — with your progress tracked topic by
topic.